Cell cycle analysis has traditionally involved using dyes such as DAPI, Hoechst, and propidium iodide to evaluate cellular DNA content by flow cytometry. However, alternative approaches have been developed, often to address common challenges. This editorial looks at some of the available options.
DNA binding dyes remain popular
According to Paul Held, Ph.D., Application Laboratory Manager within the PLXB-Cell Analysis Division at Agilent Technologies, the use of DNA binding dyes is still the most popular means to assess the cell cycle. “The main reason for this is that the use of these dyes is mechanistically very easy, yet the technology provides a significant amount of information,” he explains. “By adding just a single-color dye to a given cellular population, researchers can parse replicating cells into discrete stages of the cell cycle based on DNA content.” But, despite widespread adoption of DNA binding dyes, the inherent limitations of many established products have driven the development of other tools and techniques.
Limitations of DNA binding dyes
One of the main problems associated with using common DNA binding dyes, such as DAPI and propidium iodide, is that they require cells to be fixed and permeabilized in order to access the DNA. Consequently, they measure just a single point in time, meaning large numbers of samples are required to yield statistically relevant results. In addition, because fixation is typically alcohol-based (since cross-linking aldehyde fixatives have the potential to interfere with DNA intercalation), such dyes may not always be compatible with expressed fluorescent proteins or downstream antibody staining.
Flow cytometry panel builder Use now Let us help you design the best panel from a selection of over 3 million antibodies.
Hoechst has an advantage over DAPI and propidium iodide in that it can enter live cells. However, its utility is restricted by the need to use an ultraviolet laser for excitation. “The cytotoxicity of ultraviolet light after repeated exposures means the same cell population can only be sampled a limited number of times,” reports Inge Thijssen - van Loosdregt, Ph.D., Manager Application Scientist at Axion BioSystems. “This makes the timing of sampling critical and constrains the maximum duration of cell cycle analysis experiments.”
Irrespective of whether cells are live or fixed, DNA binding dyes cannot always distinguish specific cell cycle phases. “Identification of S phase is somewhat nebulous when using DNA content,” says Held. “Cells that are truly in S phase are actively synthesizing DNA and can be identified using modified thymidine nucleosides such as BrdU and EdU that become incorporated into the cellular genome. Likewise, mitotic cells cannot be distinguished from G2 cells using DNA content, and instead require detection with antibodies directed against the phosphorylated histone H3 protein.”
Sreethu Sankar, Product Manager at Proteintech, notes that researchers are increasingly choosing to combine cellular DNA analysis with the measurement of specific markers. “Cyclins and cyclin-dependent kinases are widely used for cell cycle analysis,” he says. “Another example is γ-H2Ax, which is often detected in combination with cell cycle arrest when screening for drugs that cause double-stranded DNA breaks. More recently, there has been a greater focus on how different epigenetic markers are diluted and re-established during the cell cycle.”
A further concern when using DNA binding dyes for cell cycle analysis stems from the fact that such reagents have the potential to directly impact DNA replication. “One could certainly speculate that Hoechst might influence DNA-protein binding as it occupies the minor groove of double-stranded DNA within a live cell,” comments Held. “Also, synchronization methods such as a double thymidine block or isoleucine deprivation could influence cell cycle dynamics.”
Alternatives to flow cytometry
Like DNA binding dyes, flow cytometry has stood the test of time for cell cycle analysis. But because flow cytometry cannot provide visual evidence of protein and cellular dynamics, its use is being augmented by other technologies. “Fluorescence microscopy is becoming ever more prominent for cell cycle analysis since it allows researchers to visualize cellular structure, cytoskeletal dynamics, and chromosomal behavior,” says Sankar. “Additionally, real-time imaging of live cells is seeing significant uptake.” To support live-cell imaging studies, Proteintech offers the Cell Cycle Chromobody®, a VHH specific to proliferating cell nuclear antigen (PCNA) that is genetically fused to a fluorescent protein. This allows for real-time monitoring of PCNA without the artifacts or cytotoxic effects that are often observed when overexpressing fluorescent fusion proteins. In addition, the Actin Chromobody® allows for tracking of cytoskeletal dynamics during the cell cycle in real time.
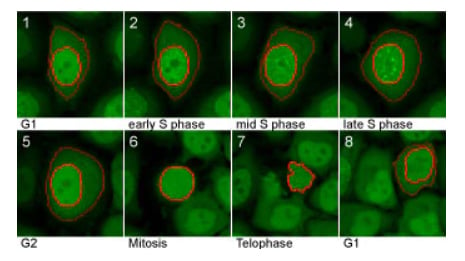
Cell Cycle Chromobody signal during the cell cycle. In G1, the Cell Cycle Chromobody signal is homogeneously distributed throughout the nucleus and cytoplasm. During S phase it accumulates in the nucleus and visualizes the formation of replication foci. In G2, the foci disappear and the cell divides (mitosis). Image provided by Proteintech.
Agilent Technologies is taking the high content imaging approach to new levels by using automated microplate fluorescence microscopy and image analysis in conjunction with liquid handling and a robotic incubator. This enables researchers to follow-fix large numbers of samples in 96- or 384-well microplates. “Each fixation represents a snapshot in time,” says Held. “At the completion of the experiment, multiple plates can be stained with DNA binding dyes as well as antibodies for imaging, thereby enabling DNA content to be related to specific protein expression or protein location. To fully appreciate the value of this strategy, consider that while flow cytometry can identify mitotic cells based on staining for phosphorylated histone H3, only phenotypic image analysis can segment them into the discrete cell division stages of prophase, metaphase, anaphase, and telophase.”

Overview of Techniques for Performing Cell Cycle Analysis. While Flow Cytometry remains one of the most popular techniques to examine the cell cycle in a cell population it is by no means the only method. Depending on the questions being asked and the throughput of the studies there are a number of other assays available for researchers using either whole cells or RNA or protein from the cell populations. The image above outlines some of these techniques along with their starting materials.
Axion BioSystems’ fluorescence live-cell imaging technology lets researchers monitor cell cycle progression over the duration of the culture from an incubator. “Using our Omni FL or Lux3 FL, it is possible for cultures to be grown in an optimal environment while minimizing handling,” explains Thijssen - van Loosdregt. These platforms complement many of the newer cell cycle dyes, such as the Fluorescent Ubiquitination-based Cell Cycle Indicator (FUCCI), enabling researchers to track the dynamics of cell cycle progression, visualize changes in morphology and behavior, and monitor the effects of treatments or interventions in real-time. Specifically, by collecting large amounts of high-resolution data and processing it using specialized software, our systems help determine key parameters like the number of cells in each phase, cycle progression rates, or cell cycle length.”
Whichever method you choose to use for cell cycle analysis, you can now be more flexible than ever before. Novel fluorescent dyes and advances in flow cytometry instrumentation are taking traditional approaches in new directions, while platforms for high content imaging and real-time monitoring of live cells represent further powerful options for your research.