Western blot imaging overview
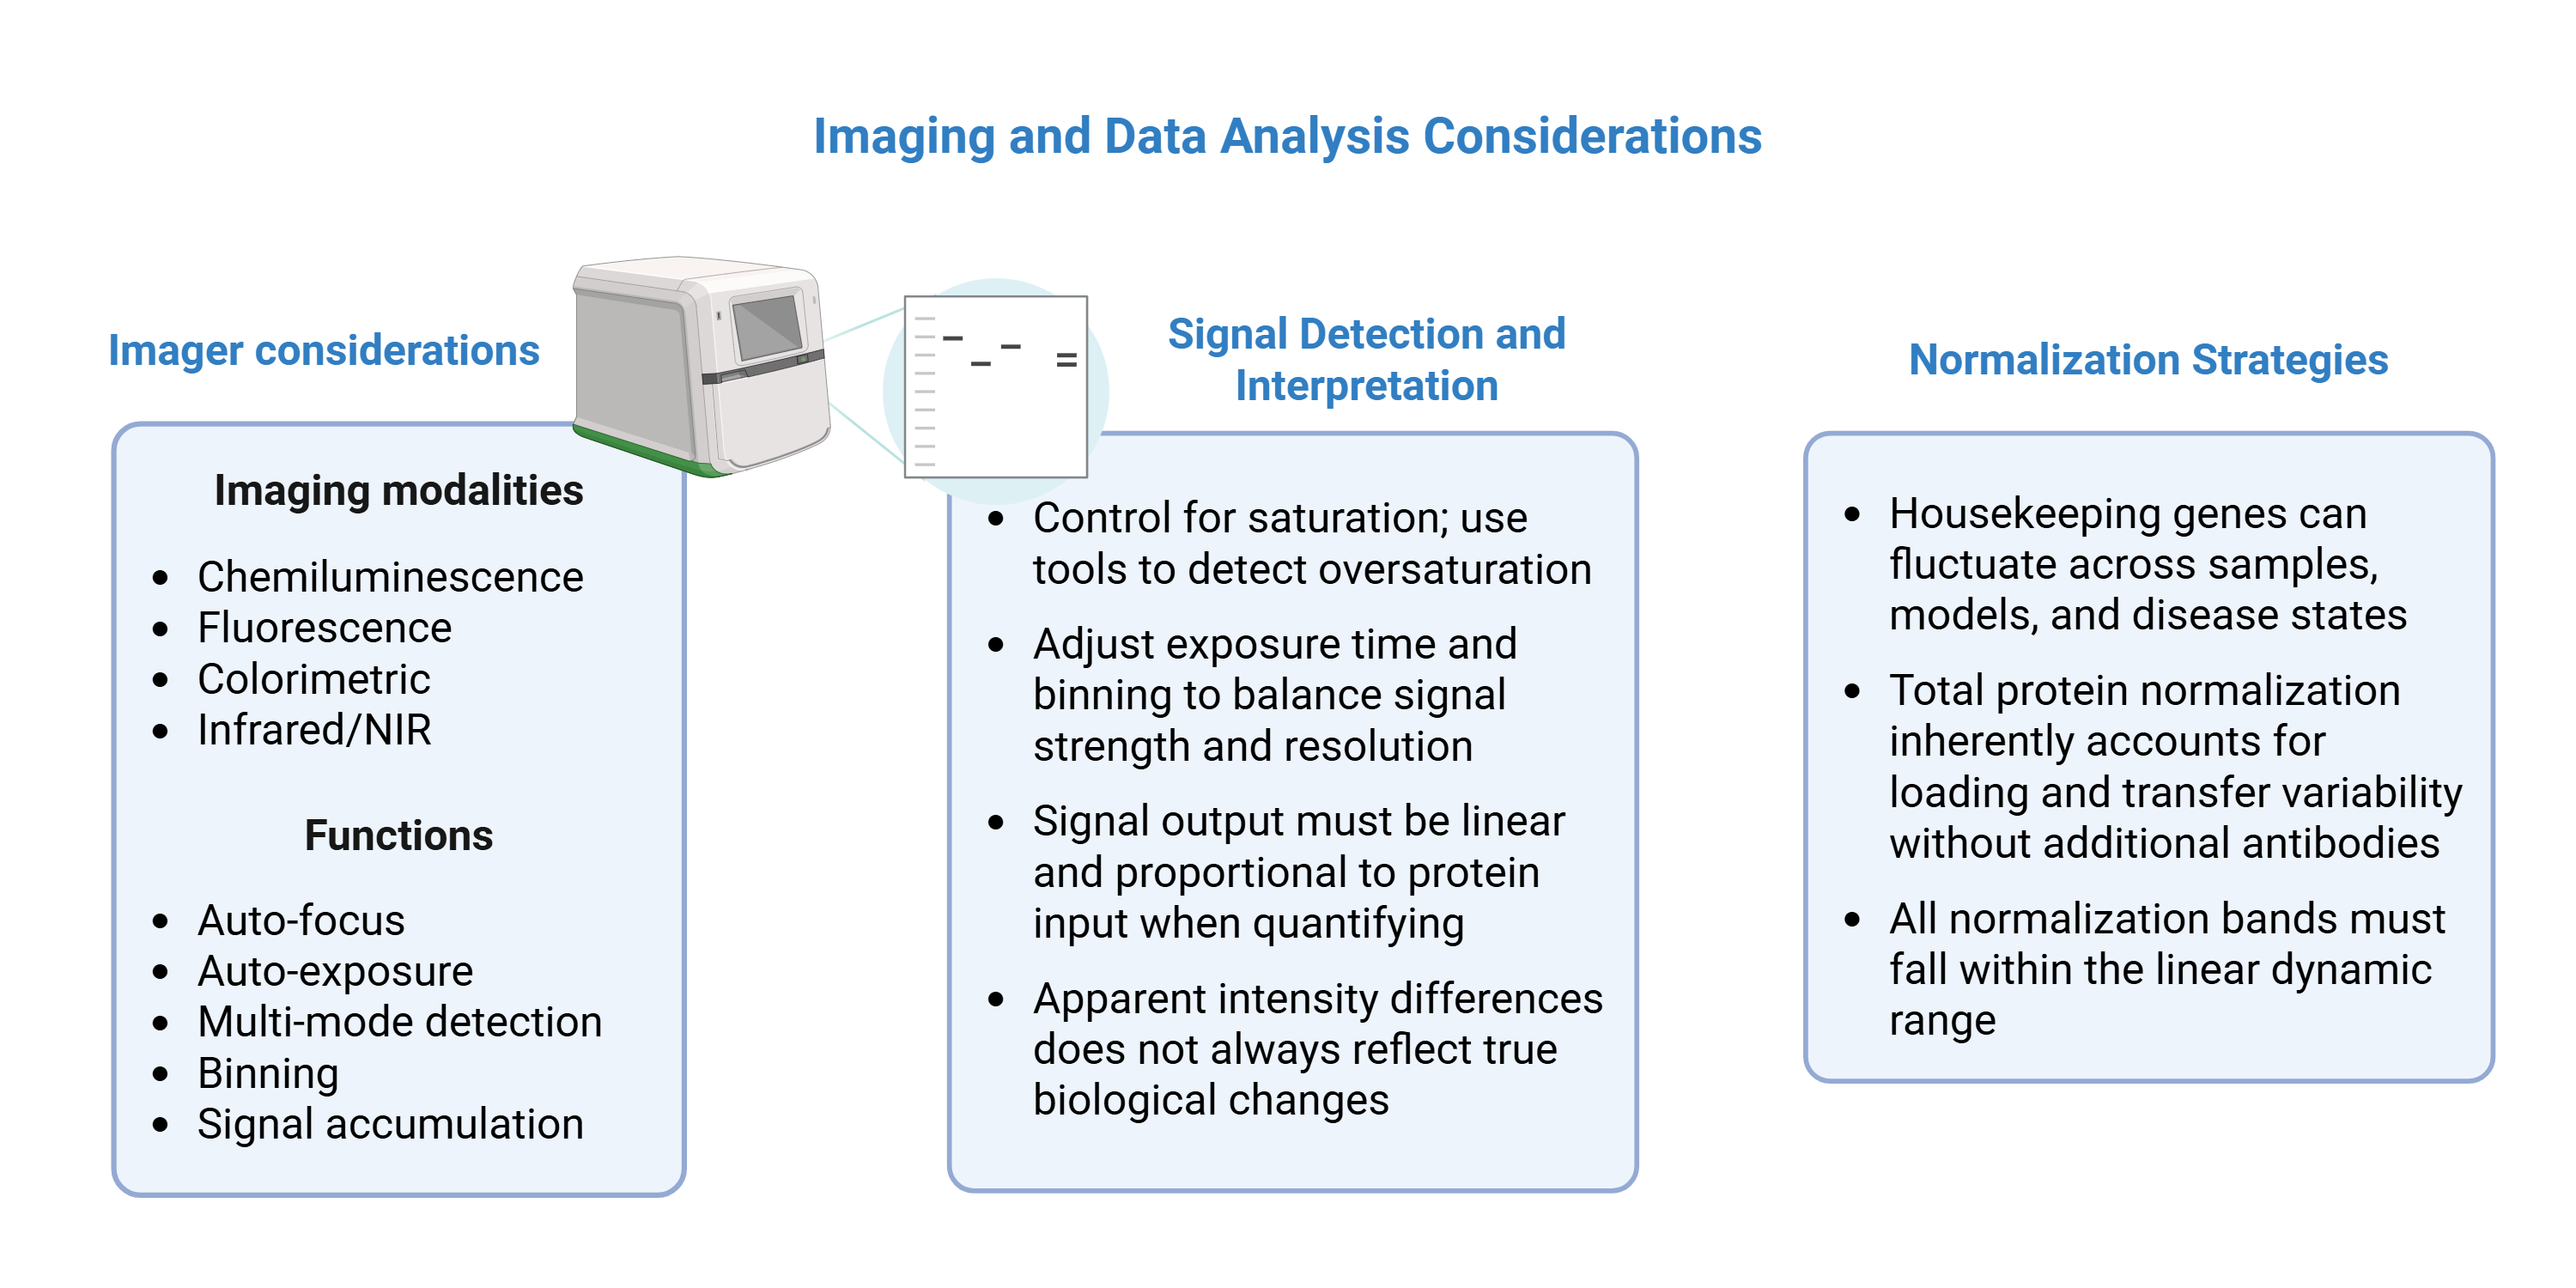
In the imaging portion of the Western blot workflow, the antibody-stained membrane is visualized and measured using specialized gel imaging systems. A variety of imagers support different detection modalities, including chemiluminescent, fluorescent, and colorimetric detection. The resulting bands reveal the proteins of interest and are used for semi-quantitative or quantitative analysis. During image acquisition, parameters such as exposure time and binning must be carefully managed to ensure signals are captured within the linear dynamic range, where signal output remains proportional to protein abundance. Signal oversaturation must be avoided, as it can lead to inaccurate quantification. Finally, responsible image manipulation and data reporting practices should be followed to ensure the reproducibility and reliability of published data.
Western blot imagers
Many imaging systems today offer sensitive and functional imaging modalities that directly enables both the visualization and analysis of Western blots. Chemiluminescence detection is often a standard capability offered by most imagers. Using sensitive CCD or CMOS cameras, these instruments capture faint light emitted directly from the blot without the need for a darkroom and film-based processing. Fluorescence-enabled imagers illuminate the blot with light at specific wavelengths (often in the red, green, and blue spectra), powered by LEDs or solid-state lasers. Multi-color fluorescence detection is necessary for performing multi-color blots and multiplexing applications, as well as in measuring fluorescent protein stains. A less common, but also powerful, modality is near-infrared (NIR) and infrared detection. This option offers a complementary advantage by significantly reducing autofluorescence from membranes, plastics, and other common electrophoresis materials, which improves the signal-to-noise ratio.
Beyond an imager’s core optical functions, users should take advantage of any software-driven features to improve the imaging portion of the workflow. Auto-focus functions can handle lens adjustment automatically to quickly provide sharp images without manual tuning. Auto-exposure balances signal intensity against background noise, protecting the gels and blots from the pitfalls of over- or under-exposure. More advanced systems go a step further by automatically adjusting exposure, lighting, and filter settings on the fly, such as setting the appropriate light source (such as UV, blue, or white light) based on the sample type or the chosen workflow. These features can help produce consistently high-quality images with minimal time and effort, regardless of the individual.
Western blot quantification
Western blots can provide semi-quantitative and quantitative information, which can depend on the experimental setup. For quantitative analyses, it should be acknowledged that within a given sample lysate, protein expression levels can span as high as one million-fold between highly and lowly expressed targets. Loading the same total protein amount per lane will inevitably result in some targets being over- or underloaded, leading to densitometric measurements falling outside of the linear dynamic range. Outside of this range, data no longer accurately reflect true differences in protein abundance.
Thus, for accurate Western blot quantification, the signal output must be linear and proportional to protein input for every target being measured. To address this, the linear detection range should be established empirically for each antibody through titration across a range of protein loads. Only values that fall within this linear range should be used for quantification. This validation should be performed under the same technical and sample conditions planned for the actual study, and ideally repeated across at least two membranes to minimize the influence of membrane-specific effects.
Signal saturation should be controlled during image acquisition for accurate quantification. Signals generated by enhanced chemiluminescence (ECL) are transient and time-dependent, and signal intensity does not remain proportional to protein abundance across all exposure conditions. Software analysis features, such as those of ImageJ/Fiji and Bio-Rad Image Lab, can be used to analyze band intensities and help detect signal oversaturation.
Adjusting key parameters on an imaging system, particularly exposure time and binning, can give users greater control over signal quality. Exposure time determines how long the sensor collects photons from the sample, and longer exposures yield stronger signals. Consider using a signal accumulation mode, which captures a series of cumulative images throughout the exposure and allows comparison across frames to identify saturation, helping to achieve optimal images. Binning merges signals from neighboring pixels into a single superpixel. For example, 3×3 binning combines nine pixels into one to boost overall sensitivity, though this comes at the cost of spatial resolution. This feature can be useful when proteins of interest produce dim signals.
Once the linearity is confirmed, the most robust approach for quantitative comparison is slope analysis, in which linear regression is applied to integrated optical density values measured across a range of increasing protein loads. Comparing slope ratios between samples corrects for inaccuracies in protein determination and allows more precise conclusions about differences in protein expression than qualitative assessments of band intensity alone.
Antibody banding patterns should also be considered, as apparent differences in band intensity do not always reflect true biological changes in protein abundance. For example, phospho-specific antibodies detect only the phosphorylated fraction of a given protein, which is typically a subset of the total protein pool detected by the corresponding total protein antibody. Keeping these factors in mind is essential for drawing accurate conclusions from densitometric data.
Western blot normalization
Two strategies have generally been used for normalization, which correct for unavoidable variations in sample loading and protein transfer efficiency between different lanes and blots. One method involves comparing band intensities with endogenous housekeeping proteins, such as GAPDH or beta-actin. However, their expression levels can fluctuate in certain conditions, such as in experiments comparing multiple cell lines, protein knockdown models, or disease states. This variability can make this method of normalization unreliable unless the stability of the loading control is explicitly confirmed for each experimental context.
The other method, increasingly considered a gold standard, is total protein normalization (TPN), which uses the entire protein signal on the blot as the normalization factor. This approach is inherently more representative of overall protein loading and automatically accounts for technical variability introduced during sample processing and transfer. Without reliance on endogenous proteins, TPN is also less affected by biological variability that may alter housekeeping protein expression, while eliminating the need for additional antibodies or extra blotting steps, simplifying the workflow. TPN can be implemented using several staining methods. Ponceau S staining is the traditional option, though it requires separate staining and de-staining steps. A more convenient alternative is the use of fluorescent stains, such as TotalStainQ and AzureRed, though these require fluorescence-enabled imagers. Other methods, such as Bio-Rad's Stain-Free system, use UV activation to visualize total protein directly in the gel and on the membrane after transfer, with no additional staining required.
Regardless of the method, normalization requires that bands are detected within their respective linear dynamic ranges. If any bands reach signal saturation, variations in loading can no longer be accurately accounted for. The relationship between sample input and signal output must be both linear and proportional. Users should also remember that sources of protein can vary when more than one biological source is used, and that even if the same amount of protein is detected between samples, these may arise from differences in cell types, tissue, or extracellular matrix. Such differences should be accounted for to ensure accurate interpretations of results.
Western blot data reporting
Several recommendations have been made for reporting Western blot findings in order to uphold high standards of transparency, reproducibility, and data integrity. When preparing blot figures for publication, it is good practice for molecular weight markers to always be included and annotated. This provides visual confirmation of protein size and ensures that bands above and below the protein of interest are visible to readers. It can also confirm that the size reference was run on the same blot and helps identify any additional bands of similar molecular weight. Lanes or bands should be excluded from comparisons that display artifacts or confounding markings. These can include band smearing associated with improper sample preparation or degradation, streaked bands in overloaded lanes caused by protein precipitation, and wavy band patterns indicative of overheated gels.
Image cropping should be minimized and full-length blots should be published wherever possible. This is particularly important for contexts such as antibody validation. Where cropping is necessary due to space or design considerations, a minimum of five to six band widths above and below the protein of interest is recommended. Any cropping, splicing, or image alteration must be clearly disclosed in a manner acceptable to the intended publication, with original files retained for as long as possible. It is also worth noting that physically cutting membranes prior to antibody incubation should be avoided, as this prevents detection of additional bands and makes it difficult to confirm that controls were run on the same gel.
Software tools can be used to review blot images for integrity issues, at rates much faster than manual checking. For example, AI-based tools can make thousands of comparisons in seconds to flag potential issues that may need attention. Especially in collaborative projects involving multiple institutions, this step provides an opportunity to identify and resolve any image concerns before publication, supporting transparency and reproducibility.
References
Estipona, D. A Brief Guide to Gel Imaging and Documentation Systems. Published June 25, 2025. Accessed March 2026. https://www.biocompare.com/Editorial-Articles/619846-A-Brief-Guide-to-Gel-Imaging-and-Documentation-Systems/
DeNies MS, Liu AP, Schnell S. Seeing beyond the blot: A critical look at assumptions and raw data interpretation in Western blotting. Biomol Concepts. 2024;15(1):10.1515/bmc-2022-0047. Published 2024 Apr 1. doi:10.1515/bmc-2022-0047
Ha SG, Park JH, Kim MY, Lee SV. Brief guide to western blot assays. Mol Cells. 2025;48(12):100297. doi:10.1016/j.mocell.2025.10029
Taylor SC, Rosselli-Murai LK, Crobeddu B, Plante I. A critical path to producing high quality, reproducible data from quantitative western blot experiments. Sci Rep. 2022;12(1):17599. Published 2022 Oct 20. doi:10.1038/s41598-022-22294-x
Tanabe L. The Next Generation of Western Blot Normalization. Biocompare. Published August 01, 2024. Accessed March 2026. https://www.biocompare.com/Editorial-Articles/614014-The-Next-Generation-of-Western-Blot-Normalization/
Kolodkin-Gal D. Best Practices for Ensuring Western Blot Image Integrity. Biocompare. Published February 12, 2024. Accessed March 2026. https://www.biocompare.com/Editorial-Articles/610549-Best-Practices-for-Ensuring-Western-Blot-Image-Integrity/
Butler TAJ, Paul JW, Chan EC, Smith R, Tolosa JM. Misleading Westerns: Common Quantification Mistakes in Western Blot Densitometry and Proposed Corrective Measures. Biomed Res Int. 2019;2019:5214821. Published 2019 Jan 21. doi:10.1155/2019/5214821
Kroon C, Breuer L, Jones L, et al. Blind spots on western blots: Assessment of common problems in western blot figures and methods reporting with recommendations to improve them. PLoS Biol. 2022;20(9):e3001783. Published 2022 Sep 12. doi:10.1371/journal.pbio.3001783