The Origins of Digital PCR
The first PCR paper was published in 1986 by K. Mullis.1 PCR is an end-point measurement technique, where the results of the amplification are measured after the reaction is finished, usually through an agarose gel.
qPCR, first published in 1993, offers real-time measurements, recording fluorescence throughout the reaction time, and allows comparative quantification of DNA.2
dPCR, on the other hand, is an end-point PCR. The idea is simple, thought of in 1992, and based on the statistical equation of Poisson, first described in 1837.3 If a sample with DNA is diluted enough, the sample can be separated into thousands of individual compartments (partitions), most will have either 1 or 0 copies of target DNA, distributed randomly. In each compartment, a classic PCR reaction is performed. Researchers can then measure if any target DNA was amplified in each partition. The Poisson distribution is used to calculate the exact number of starting copies of target DNA based on the number of partitions that are “positive” and “negative” for amplification.
This was first achieved in 1999 by Vogelstein and Kinzler, who coined the term “digital PCR.”4 Their method was inefficient, as they used a 96-well plate to carry out individual reactions, taking too much time and space in comparison to a single-tube PCR. But they used endpoint fluorescence analysis to determine positive vs negative reactions, turning each well into a binary count for statistical analysis. The combination of partitioning in individual reactions + endpoint PCR + qPCR-style fluorescent readout is the foundation of today’s dPCR workflows.
A race to improve the partitioning of the reaction started. The first commercial dPCR system using chip technology, the BioMark™, was launched in 2006 by Fluidigm. Here, microfluidics was used to create 9,180 reactions per chip.
But the cost was still too high. The possibility of creating droplets through oil-water emulsion was already being researched, and in 2011, Bio-Rad launched the QX100 Droplet Digital PCR system, which created up to 20,000 droplets per sample with a much lower reaction cost.5,6
There have been many improvements since then, including new dPCR systems, but these were the foundations of absolute quantification of nucleic acids through PCR.
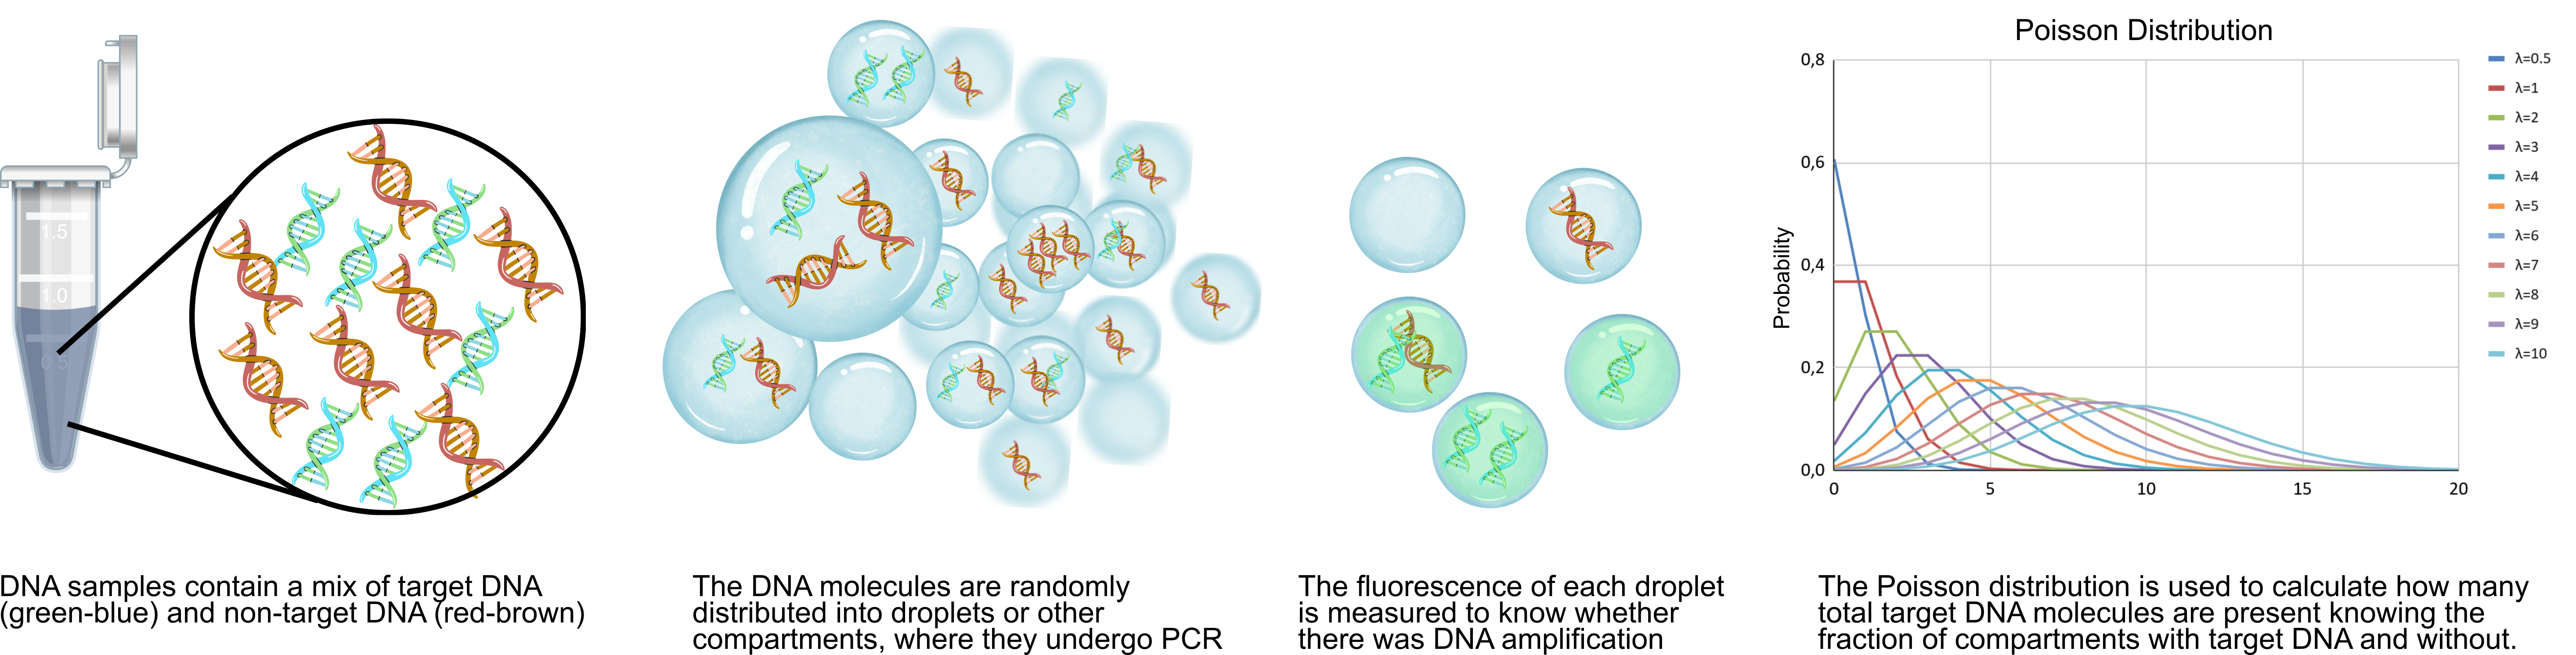
Figure 1. Basic principles of droplet digital PCR, a type of dPCR, from sample to analysis. In other types of dPCR, partitions take a different form than droplets, but the principle is the same.
Types of dPCR and dPCR Systems
dPCR is an umbrella term: multiple types exist, with the main difference being their partitioning method. The most common system is ddPCR, where droplets are created through an emulsion, to partition the reaction into thousands of binary events.
Additionally, ddPCR systems are all commercialized by Bio-Rad. The early launch and low costs of ddPCR have allowed Bio-Rad to retain a huge market share, with ddPCR being featured in over 12,000 peer-reviewed publications. But other platforms are emerging from new and established brands. An overview can be found in Table 1.
Table 1: Some of the main commercial dPCR systems, by launch year.
| Manufacturer | Technology | Partitioning
Method | Partitions | Launch | Current Status |
|---|
| Fluidigm (now Standard BioTools) |
BioMark™ HD / EP1 |
Microfluidic chip |
~765–36,000 |
2006 |
Discontinued
(as of ~2020) |
| Bio-Rad Laboratories |
QX100™ Droplet Digital™ PCR (ddPCR™) |
Water-in-oil emulsion droplets |
~20,000 |
2011 |
Available
(QX200™, QX600™, and AutoDG™ systems) |
| RainDance Technologies |
RainDrop™ Digital PCR System |
Water-in-oil emulsion picodroplets |
Up to 10 million |
2013 |
Discontinued
(acquired by Bio-Rad in 2017) |
| Life Technologies (now Thermo Fisher Scientific) |
QuantStudio™ 3D Digital PCR |
Chip-based (plates with microwells) |
~20,000 |
2013 |
Discontinued
(replaced by Absolute Q in 2022) |
| Formulatrix |
Constellation® dPCR |
Plate-based nanoplate (microwells) |
Up to
~48,000 |
2013 |
Rebranded
(acquired, became QIAcuity in 2020) |
| Stilla Technologies |
naica® System (Crystal Digital PCR™) |
Crystal Digital PCR (emulsion droplets in 2D array) |
~30,000 |
2016 |
Available
(acquired, but continues under Stilla brand) |
| Qiagen |
QIAcuity® Digital PCR System |
Nanoplate (microwells in plate format) |
~8,500–26,000 |
2020 |
Available
(One, Four, and Eight plate versions) |
| Thermo Fisher Scientific |
QuantStudio™ Absolute Q Digital PCR System |
Microfluidic array (chip-based dead-end chambers) |
~20,000 |
2021 |
Available
(fully integrated chip-based system) |
| Roche Diagnostics |
Digital LightCycler® System |
Microchamber array (chip-based) |
Up to 100,000 |
2022 |
Available
(IVD-focused, CE-marked, FDA 510(k) exempt) |
| Stilla Technologies (Bio-Rad subsidiary) |
Nio® / Nio®+ Digital PCR |
Crystal Digital PCR (next-gen emulsion droplets) |
~30,000+ |
2023 |
Available
(7-color multiplexing, successor to naica®) |
Looking for specific systems and their differences? Check out our guide on dPCR assay design, platform selection, and experiment setup.
dPCR vs qPCR: When to Use Which
Despite dPCR’s technological advancements, qPCR is often faster, cheaper, and handles more samples at once, so it is still used for high-throughput screening and broad dynamic range applications. The classical 384-well format and lower reagent costs maximize the efficiency of qPCR in those cases. qPCR allows relative quantitation, and multiplex qPCR is a great way to compare the presence and relative quantity of multiple DNA targets at once, and in real time.
However, qPCR's reliance on primer amplification efficiency can create substantial problems: a 10% reduction in efficiency (from 100% to 90%) can shift calculated concentrations by 2-fold or more.7 Ct values above 35–40 cycles become increasingly unreliable, as late-stage amplification risks non-specific product formation and primer-dimer artifacts that cannot be distinguished from target amplicons.
dPCR’s binary endpoint detection eliminates these issues. Because each partition is simply positive/negative, results are independent of amplification efficiency. A partition with 1 copy is counted as positive, just as one with 100 copies.
This robustness extends to inhibitor-tolerant quantification of low-abundance targets: where qPCR Ct values shift unpredictably with crude samples (blood, soil, etc.), dPCR maintains accuracy because inhibitors affect all partitions equally rather than altering exponential curves.8
dPCR is also much more precise, resolving up to 1.2-fold copy number differences and detecting rare variant allele frequencies down to 0.1 %, a level of accuracy unattainable by qPCR's analysis of standard curve interpolation.9
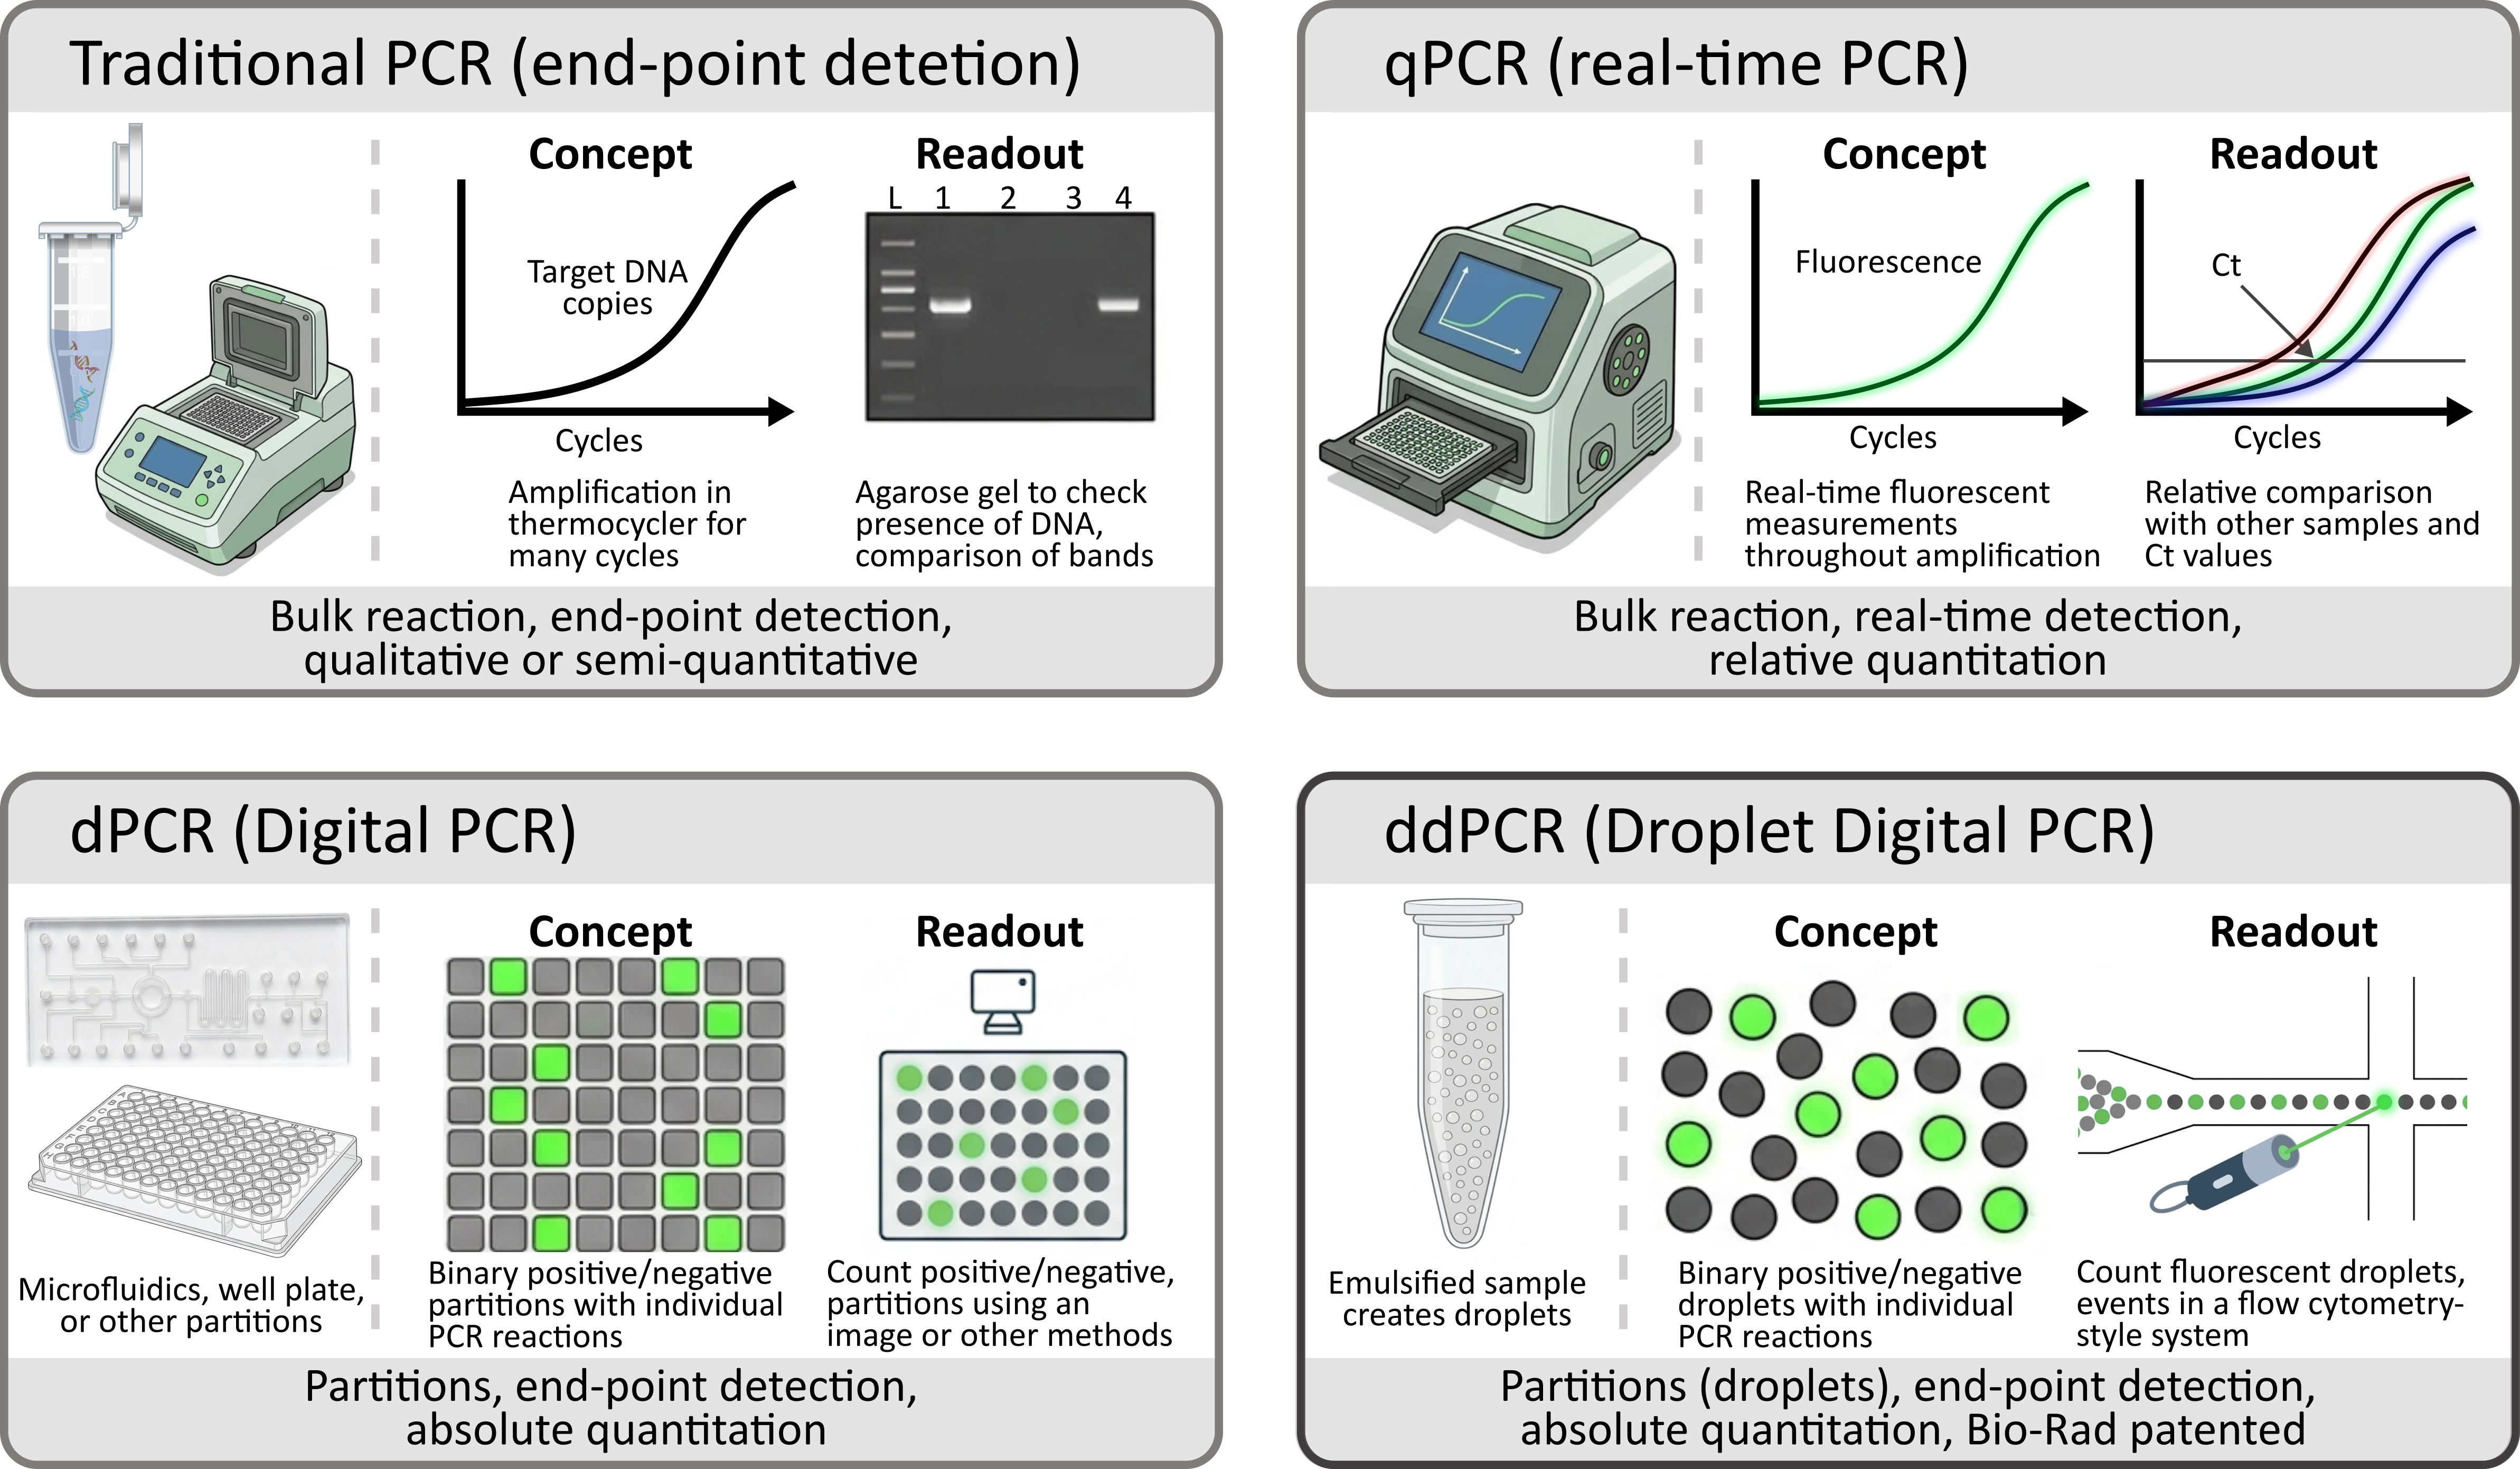
Figure 2: Comparison of PCR, qPCR, dPCR, and ddPCR, their concept, and readout systems.
Absolute quantification requires no standard curves and eliminates variability
A major issue with qPCR is the run-to-run variability, especially when the same experiment is performed at different labs.10 This stems from human error, using the same reagents and primers with different conditions, among others. Standard curve errors directly impact the readout as the target DNA quantity is compared against the standard curve.
Because dPCR requires no standard curves, it eliminates this variability entirely. While dPCR is not perfect, as human error still plays a part, a comparative study on RT-qPCR vs RT-dPCR shows that inter- and intra-lab variations were much lower for dPCR experiments than qPCR ones.11
Wondering how to analyze and interpret dPCR data? Our workflow and guide for dPCR data analysis might help.
Throughput and cost considerations
When deciding when to use dPCR over qPCR, throughput and cost are the primary concerns.
Reagent cost is quite important for long-term use, and qPCR reagent cost per sample tends to be lower than that of dPCR, although with different systems, the cost per sample of dPCR can change significantly.12 However, dPCR does not need standard curves nor (usually) technical replicates, so fewer samples are run.
The capital investment required also varies, with qPCR instruments costing between $15,000 to $50,000, and dPCR systems requiring a $40,000 to $100,000+ investment.
Throughput differs significantly: qPCR can process 384 samples in ~90 minutes, while dPCR handles 96 samples in ~5 hours.
Major Applications for dPCR
dPCR entered the market after qPCR was already widely established, so many laboratories have qPCR infrastructure but lack dPCR instruments. The higher capital and per-sample cost of dPCR systems makes adoption and use a deliberate choice rather than the default one. The following section goes over applications where dPCR's benefits justify the investment.
Oncology and liquid biopsy: ctDNA and MRD detection
Non-invasive cancer tests have been on the rise in the last decade. Among those are liquid biopsies, where blood or other fluids like urine or tears can be used to check for the presence of cancer signals.13
For solid tumors, oncology treatments cause cell death. This causes small amounts of cell-free DNA (cfDNA), including circulating tumor DNA (ctDNA), to be released into the bloodstream. For blood cancer, DNA or RNA from circulating cells is present in the blood.
After surgery or treatment of tumors, NGS is ideal to know which mutations are present in the tumor, but dPCR can be used for minimal residual disease monitoring and to know when treatments can be stopped, as it shows a limit of detection of 0.1%.14, 15
dPCR tests are approved for the monitoring of chronic myeloid leukemia from blood samples, like the Bio-Rad QXDx BCR-ABL %IS Test or the Sniper BCR‑ABL1 (p210) %IS kit. Both measure BCR-ABL1 RNA more accurately than qPCR.16
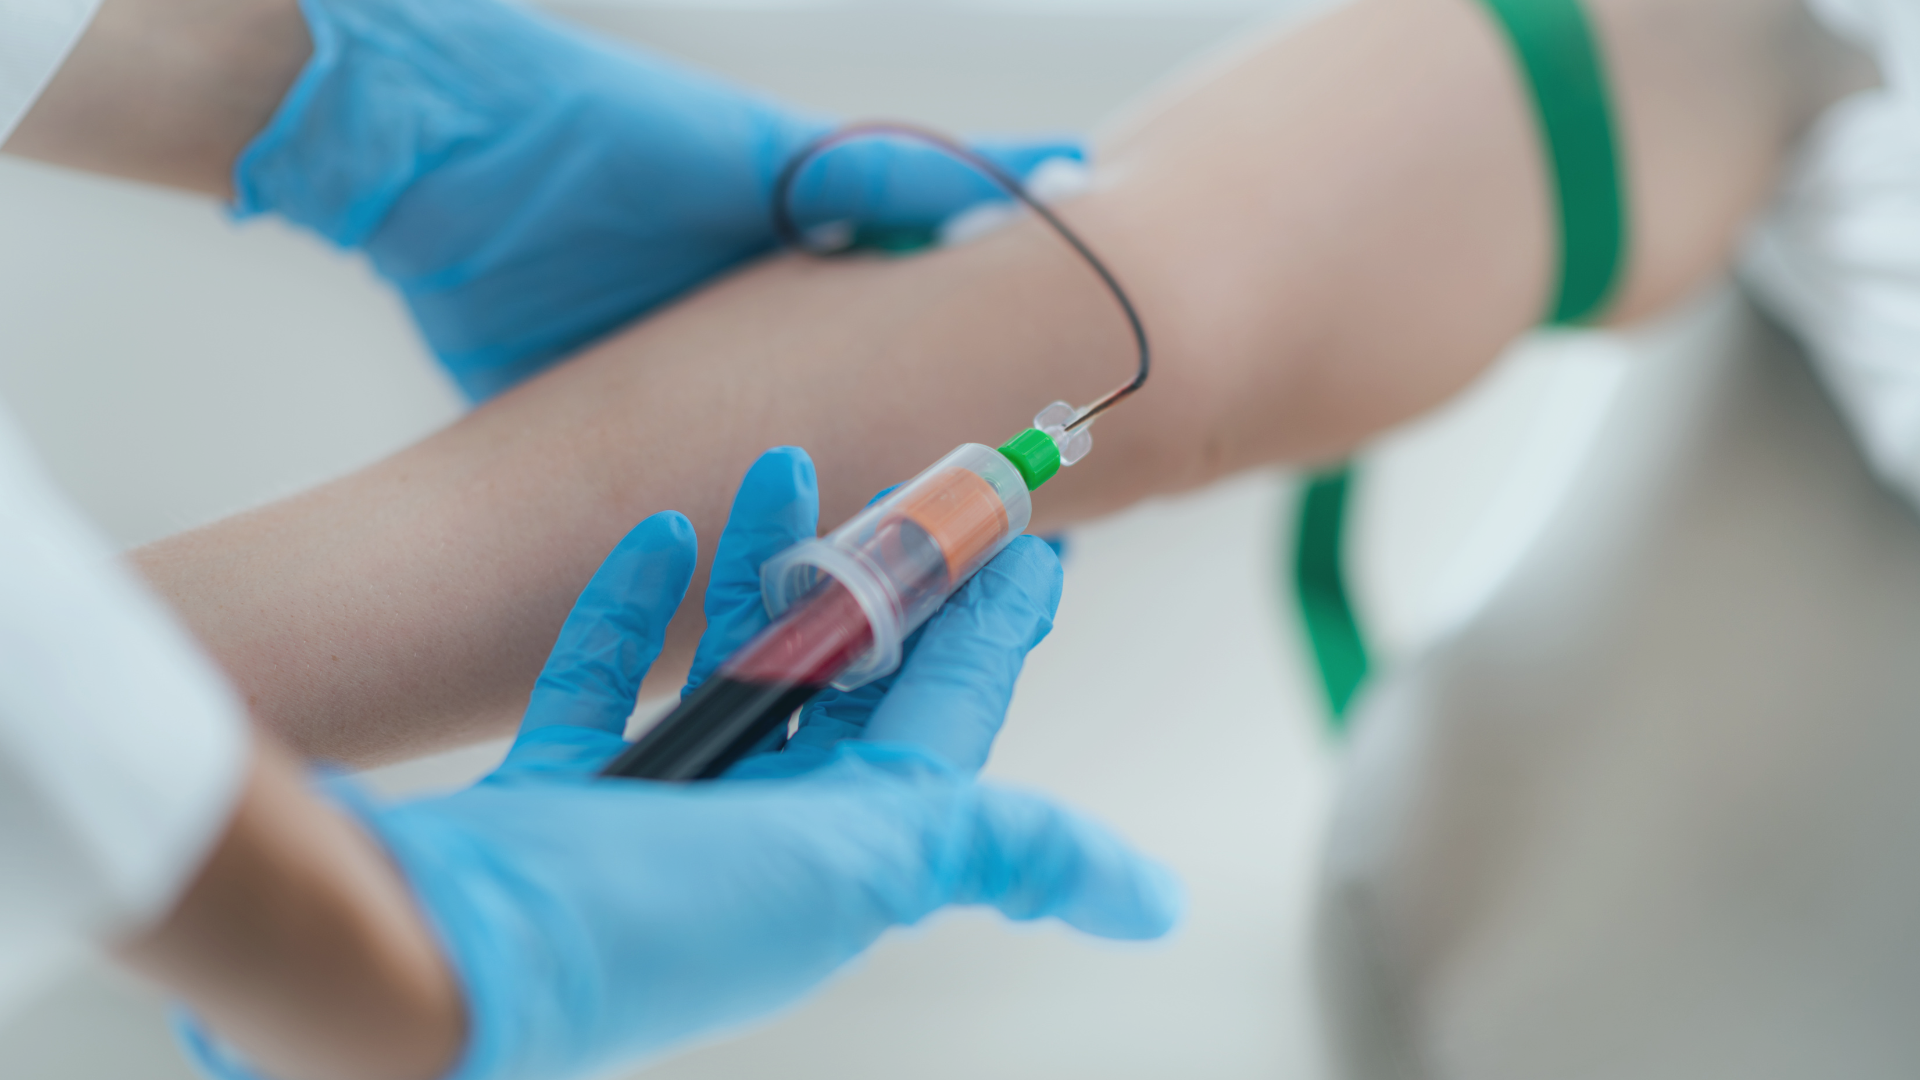
Figure 3. Liquid biopsy (blood) for diagnostic purposes.
Copy number variation and cell and gene therapies
Copy number variations (CNVs) are duplications or deletions of DNA segments, which affect around 12% of the human genome.17 CNV demands precise quantification for cancer diagnostics (HER2 amplification for HER2 status in breast cancer) and gene therapy safety (vector copy number).
Because of the absolute quantification of nucleic acids, dPCR eliminates reference gene instability, a critical flaw in relative quantification methods, like qPCR, array comparative genomic hybridization, and paralogue ratio testing.18 dPCR can also be used for integrated viral genome monitoring, like in ongoing HIV infections, allowing total quantification of proviruses to determine HIV persistence.19
In cell and cell and gene therapy manufacturing, dPCR provides better sensitivity than qPCR for AAV vector genome quantification without standard curves, enabling precise potency dosing and CAR-T transduction efficiency measurements.
Pathogen detection and viral load quantification
dPCR can be used to quantify pathogens from low-count fluids with high inhibitor content. An example is absolute viral load quantification from blood and plasma samples. dPCR has proved more effective than qPCR for cytomegalovirus detection in patients after transplantation, and it also enables more precise cross-laboratory monitoring of intervention strategies.20
The same can be said for environmental samples. In a 24-month SARS-CoV-2 wastewater monitoring study, RT-dPCR was able to accurately detect low viral loads in samples where RT-qPCR returned negative or marginal results (Ct 36–40).21
Bacterial detection can also be improved with dPCR. A quadruplex ddPCR assay was used to simultaneously detect four major foodborne bacterial pathogens (Salmonella Typhi, Staphylococcus aureus, Listeria monocytogenes, and Bacillus cereus) with detection limits of 7–9 copies per reaction, showing equivalent accuracy to plate counting. However, ddPCR took five hours while cultures normally take 2-9 days.22
Overall, dPCR has many potential applications. While reagent costs and initial investment are higher than those required by qPCR or other methods, the added sensitivity and benefits often outweigh the drawbacks.
This article is part of a 3-part series on digital PCR. Continue reading:
Frequently Asked Questions (FAQs)
Q1: Does dPCR require a standard curve? No. dPCR provides absolute quantification of target DNA copy number directly from the ratio of positive to negative droplets using the Poisson distribution, eliminating the need for standard curves and reducing run-to-run variability.
Q2: Can dPCR be multiplexed? Yes. Modern systems support multi-color multiplexing, allowing simultaneous detection of several targets in one reaction.
Q3: What sample types are better analyzed with dPCR than with qPCR? dPCR works well with high-inhibitor, low-input samples, like plasma, whole blood, urine, and environmental samples like wastewater. Its tolerance to inhibitors makes it especially suited for crude or low-input samples. qPCR struggles with such samples.
Q4: How sensitive is dPCR compared to NGS for mutation detection? Both reach ~0.1% variant allele frequency, but dPCR is faster, cheaper per target, and easier to validate clinically. NGS is preferred for broad mutation profiling, and dPCR excels at monitoring known, specific variants, as primers need to be designed to target them.
Q5: Is dPCR approved for clinical diagnostic use? Some assays are. The Bio-Rad QXDx BCR-ABL %IS Test and the Sniper BCR ABL1 (p210) %IS kit are FDA-cleared for chronic myeloid leukemia monitoring. Regulatory-grade dPCR use is expanding due to the absolute quantification it provides, but still limited.
References
1. Mullis K, Faloona F, et al. Specific enzymatic amplification of DNA in vitro: the polymerase chain reaction. Cold Spring Harbor Symposia on Quantitative Biology. https://doi.org/10.1101/sqb.1986.051.01.032
2. Higuchi R, Fockler C, et al. Kinetic PCR analysis: real-time monitoring of DNA amplification reactions. Biotechnology (N Y). https://doi.org/10.1038/nbt0993-1026
3. Sykes PJ, Neoh SH, et al. Quantitation of targets for PCR by use of limiting dilution. BioTechniques. PMID: 1389177.
4. Vogelstein B, Kinzler KW. Digital PCR. Proceedings of the National Academy of Sciences of the United States of America. PMID: 10430926.
5. Thorsen T, Roberts RW, et al. Dynamic pattern formation in a vesicle-generating microfluidic device. Physical Review Letters. https://doi.org/10.1103/PhysRevLett.86.4163
6. Hindson BJ, Ness KD, et al. High-throughput droplet digital PCR system for absolute quantitation of DNA copy number. Anal Chem. https://doi.org/10.1021/ac202028g
7. Ruiz-Villalba A, Ruijter JM, et al. Use and misuse of Cq in qPCR data analysis and reporting. Life (Basel). https://doi.org/10.3390/life11060496
8. Dingle TC, Sedlak RH, et al. Tolerance of droplet-digital PCR versus real-time quantitative PCR to inhibitory substances. Clin Chem. https://doi.org/10.1373/clinchem.2013.211045
9. Berman J, Benig V, et al. Droplet Digital PCR: High-resolution copy number variation analysis. Bio-Rad Bulletin 6475. https://www.bio-rad.com/webroot/web/pdf/lsr/literature/Bulletin_6475.pdf
10. Taylor SC, Nadeau K, et al. The ultimate qPCR experiment: producing publication quality, reproducible data the first time. Trends Biotechnol. https://doi.org/10.1016/j.tibtech.2018.12.002
11. Boxman ILA, Molin R, et al. An international inter-laboratory study to compare digital PCR with ISO standardized qPCR assays for the detection of norovirus GI and GII in oyster tissue. Food Microbiol. https://doi.org/10.1016/j.fm.2024.104478
12. Verhaegen B, De Reu K, et al. Comparison of droplet digital PCR and qPCR for the quantification of Shiga toxin-producing Escherichia coli in bovine feces. Toxins. https://doi.org/10.3390/toxins8050157
13. Semenkovich NP, Szymanski JJ, et al. Genomic approaches to cancer and minimal residual disease detection using circulating tumor DNA. J Immunother Cancer. https://doi.org/10.1136/jitc-2022-006284
14. Kockerols C, Valk PJM, et al. BCR-ABL1 deep molecular response quantification and transcript type identification in chronic myeloid leukemia using a US Food and Drug Administration–approved droplet-based digital PCR assay. J Mol Diagn. https://doi.org/10.1016/j.jmoldx.2024.11.003
15. Zhu L, Xu R, et al. Minimal residual disease (MRD) detection in solid tumors using circulating tumor DNA: a systematic review. Front Genet. https://doi.org/10.3389/fgene.2023.1172108
16. Scott S, Cartwright A, et al. Assessment of droplet digital polymerase chain reaction for measuring BCR-ABL1 in chronic myeloid leukaemia in an international interlaboratory study. Br J Haematol. https://doi.org/10.1111/bjh.17521
17. Redon R, Ishikawa S, et al. Global variation in copy number in the human genome. Nature. https://doi.org/10.1038/nature05329
18. Walker S, Janyakhantikul S, et al. Multiplex paralogue ratio tests for accurate measurement of multiallelic CNVs. Genomics. https://doi.org/10.1016/j.ygeno.2008.09.004
19. Anderson EM, Maldarelli F, et al. Quantification of HIV DNA using droplet digital PCR techniques. Curr Protoc Microbiol. https://doi.org/10.1002/cpmc.62
20. Sedlak RH, Cook L, et al. Clinical utility of droplet digital PCR for human cytomegalovirus. J Clin Microbiol. https://doi.org/10.1128/JCM.00803-14
21. Chai X, Liu S, et al. Surveillance of SARS-CoV-2 in wastewater by quantitative PCR and digital PCR: a case study in Shijiazhuang city, Hebei province, China. Emerg Microbes Infect. https://doi.org/10.1080/22221751.2024.2324502
22. Sun X, Xiao J, et al. A ddPCR method for simultaneous detection and quantification of Salmonella enterica, Staphylococcus aureus, Listeria monocytogenes, and Bacillus cereus in foods. Sci Rep. https://doi.org/10.1038/s41598-025-17272-y