Multiplex Imaging in Spatial Biology
For decades, spatial biology and tissue analysis relied on immunohistochemistry and immunofluorescence (IHC/IF). These remain important tools, but they are fundamentally limited in how many markers they can measure at once—typically 2–4 per section. That is enough to confirm the presence of a cell type, but not enough to reconstruct a complex cell state or understand how different cell populations interact across a tissue section.2 Multiplex imaging takes care of the problem by detecting many molecules in a single tissue section, sequentially or all at once.
Types of Multiplex Imaging for Spatial Proteomics
In cyclic immunofluorescence approaches, a tissue section is stained and imaged with fluorescently labeled antibodies. Then, the signal is inactivated, either by chemical quenching, photobleaching, or antibody stripping, before the next set of markers is applied.3 By combining multiple cycles, researchers can observe 60+ protein targets on the same tissue section while retaining the spatial position of every cell. Cyclic IF platforms such as the Leica Cell DIVE or Lunaphore COMET have made this workflow practical for routine studies, offering high-plex panels on FFPE or frozen tissue at single-cell resolution.
A subset of those platforms are DNA-barcoded antibody platforms, which achieve similar plex by tagging antibodies with oligonucleotides and reading them out through iterative hybridization, rather than relying on distinct fluorophores.4 Systems like the Akoya PhenoCycler use this to detect 40+ markers.
Mass spectrometry imaging is a separate technique, using metal-tagged antibodies detected by laser ablation, completely avoiding fluorescence spectral overlap.5 Platforms like the Standard BioTools Hyperion or MIBIscope can measure ~40 markers with subcellular resolution, trading some throughput and field of view for very clean signal separation.
The core technical challenge in all of these approaches is the same: the tissue must survive multiple rounds of treatment and imaging, and every image cycle must be computationally registered to the same spatial coordinate system, so that each marker is correctly assigned to each cell.
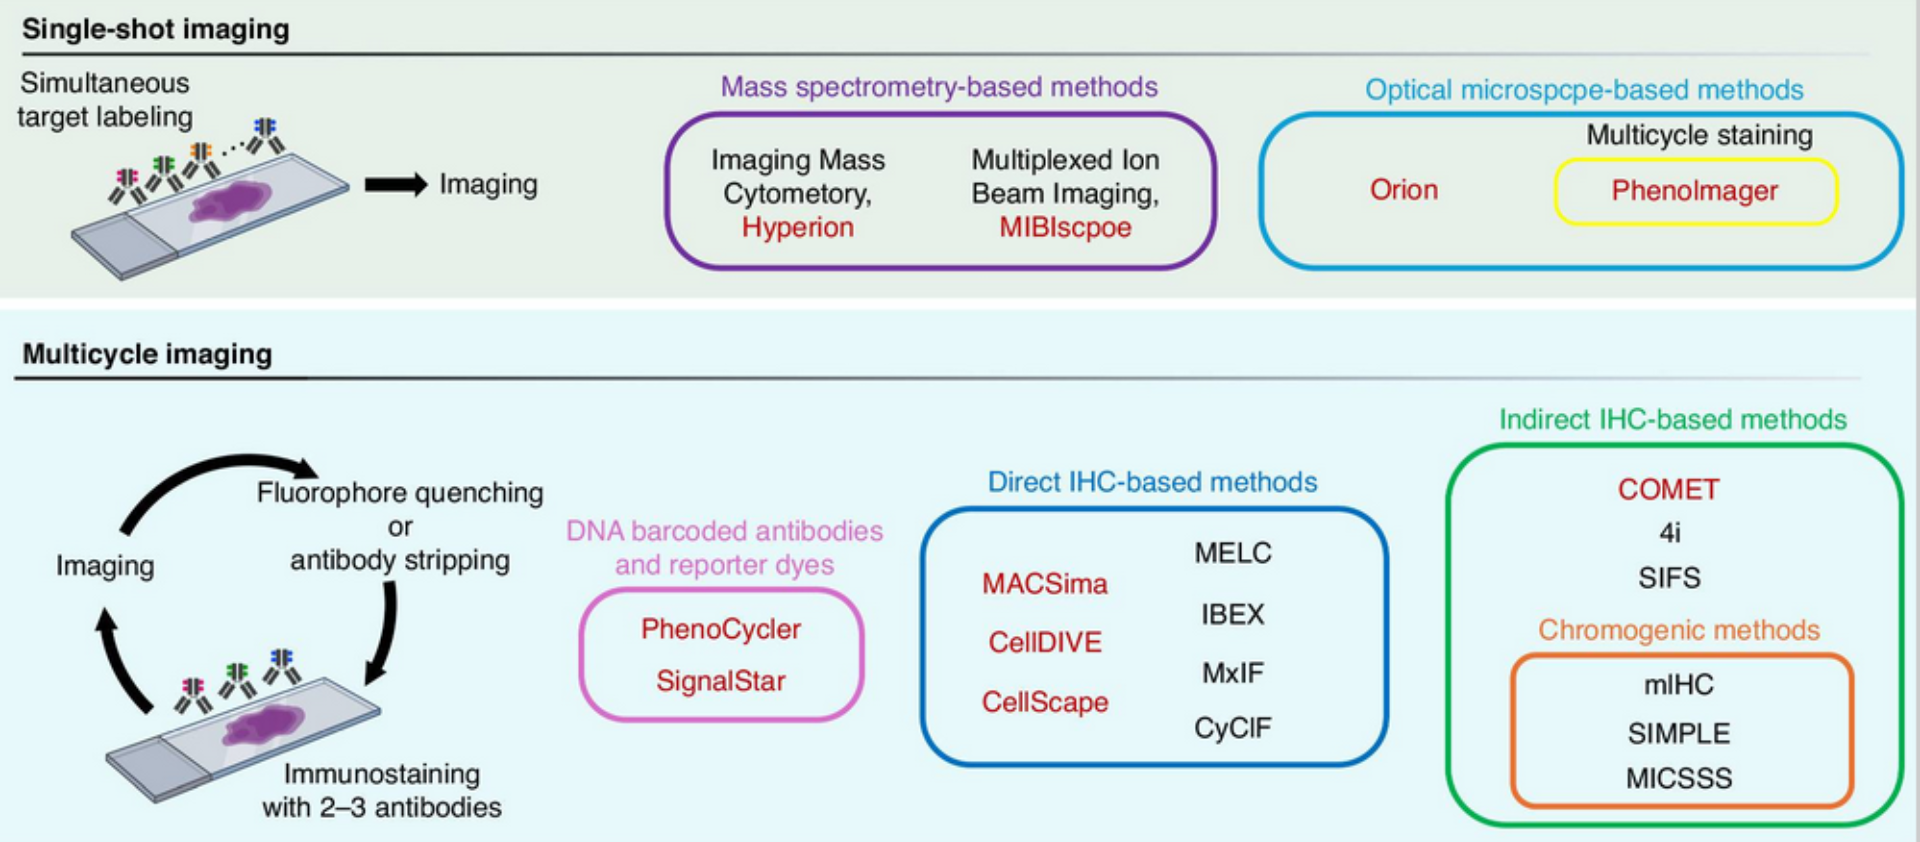
Figure 1: Main systems and their mode of work for multiplex imaging in spatial proteomics. Source: Semba T, Ishimoto T. Br J Cancer. 2024.4
Spatial transcriptomics
Imaging-based spatial transcriptomics (iST) applies the same iterative imaging logic to RNA rather than protein. Platforms such as 10x Genomics Atera, Bruker CosMx, and Vizgen MERSCOPE use iterative smFISH-based chemistries to detect hundreds to thousands of RNA species directly in tissue sections, preserving spatial context.6 This article focuses on protein imaging, but iST platforms are part of the same spatial biology ecosystem, and combined protein and RNA workflows are increasingly common in research settings.
Technology Review
Several classes of platforms enable multiplex spatial analysis at the protein and RNA level. The table below compares representative systems used for spatial proteomics across key technical parameters.
Table 1: Main commercial platforms for spatial proteomics
| Platform | Approach | Antibody Type | Signal Removal Method | Company | Max Markers | Key Specifications |
|---|
| Cell DIVE |
Direct IF multicycle |
Fluorophore-conjugated primary |
Photobleaching |
Leica Microsystems |
60+ |
Antibody-agnostic; whole-slide FFPE and frozen; AI-powered image analysis |
| MACSima |
Direct IF multicycle |
Fluorophore-conjugated primary |
Automated fluorophore bleaching |
Miltenyi Biotec |
200 |
Protein + RNA detection on the same section; fully automated fluidics; FFPE and frozen compatible |
| CellScape |
Direct IF multicycle |
Fluorophore-conjugated primary |
Filtered photobleaching |
Bruker |
40+ |
Tissue-protective photobleaching protocol; designed for fragile FFPE samples across many cycles |
| CellScape XR |
Direct IF multicycle |
Fluorophore-conjugated primary |
EpicIF™ rapid whole-slide signal removal |
Bruker |
200+ |
182 nm/pixel; >700 mm² whole-slide imaging; >2× throughput vs original CellScape; demonstrated 208-plex panels |
| COMET |
Indirect IF multicycle |
Off-the-shelf primary antibody |
Automated fluidics / stripping |
Lunaphore |
40+ |
Fastest cycle turnaround; fully automated on-instrument staining; no custom-conjugated antibodies required |
| PhenoCycler-Fusion 2.0 |
DNA-barcoded multicycle |
DNA-barcoded primary + fluorescent reporter oligos |
Chemical stripping of reporter oligos |
Akoya Biosciences |
100+ |
Single staining step with full panel; whole-slide automated imaging; high-throughput |
| Orion and Orion LE |
Fluorescence single-shot |
Fluorophore-conjugated primary |
None |
RareCyte |
20 |
Single staining round; whole-slide imaging; no cycling overhead |
| EVOS S1000 |
Fluorescence single-shot |
Fluorophore-conjugated primary |
None |
Thermo Fisher |
9 |
On-board spectral unmixing; 9-plex in <1 hour per cm²; launched 2025 |
| Orion HT |
Fluorescence single-shot |
Fluorophore-conjugated primary |
None |
RareCyte |
18–20 |
20-channel single-round IF; 30-slide walk-away automation; built for clinical-scale cohorts |
| PhenoImager HT 2.0 |
Multispectral fluorescence single-shot |
HRP-conjugated + TSA |
None |
Akoya Biosciences / Quanterix |
7–9 |
Spectral unmixing; 400+ slides/week throughput; compatible with Opal dye panels |
| MIBIscope |
Mass spec single-shot |
Metal-conjugated primary |
Ion beam ablation |
IONpath |
40+ |
~260 nm–1 µm spatial resolution; single staining round; no fluorescence spectral overlap |
| Hyperion XTi |
Mass spec single-shot |
Metal-conjugated primary |
Laser ablation |
Standard BioTools |
40+ |
Automated 40-slide batch loading; protein + RNA co-detection; subcellular resolution ~1 µm |
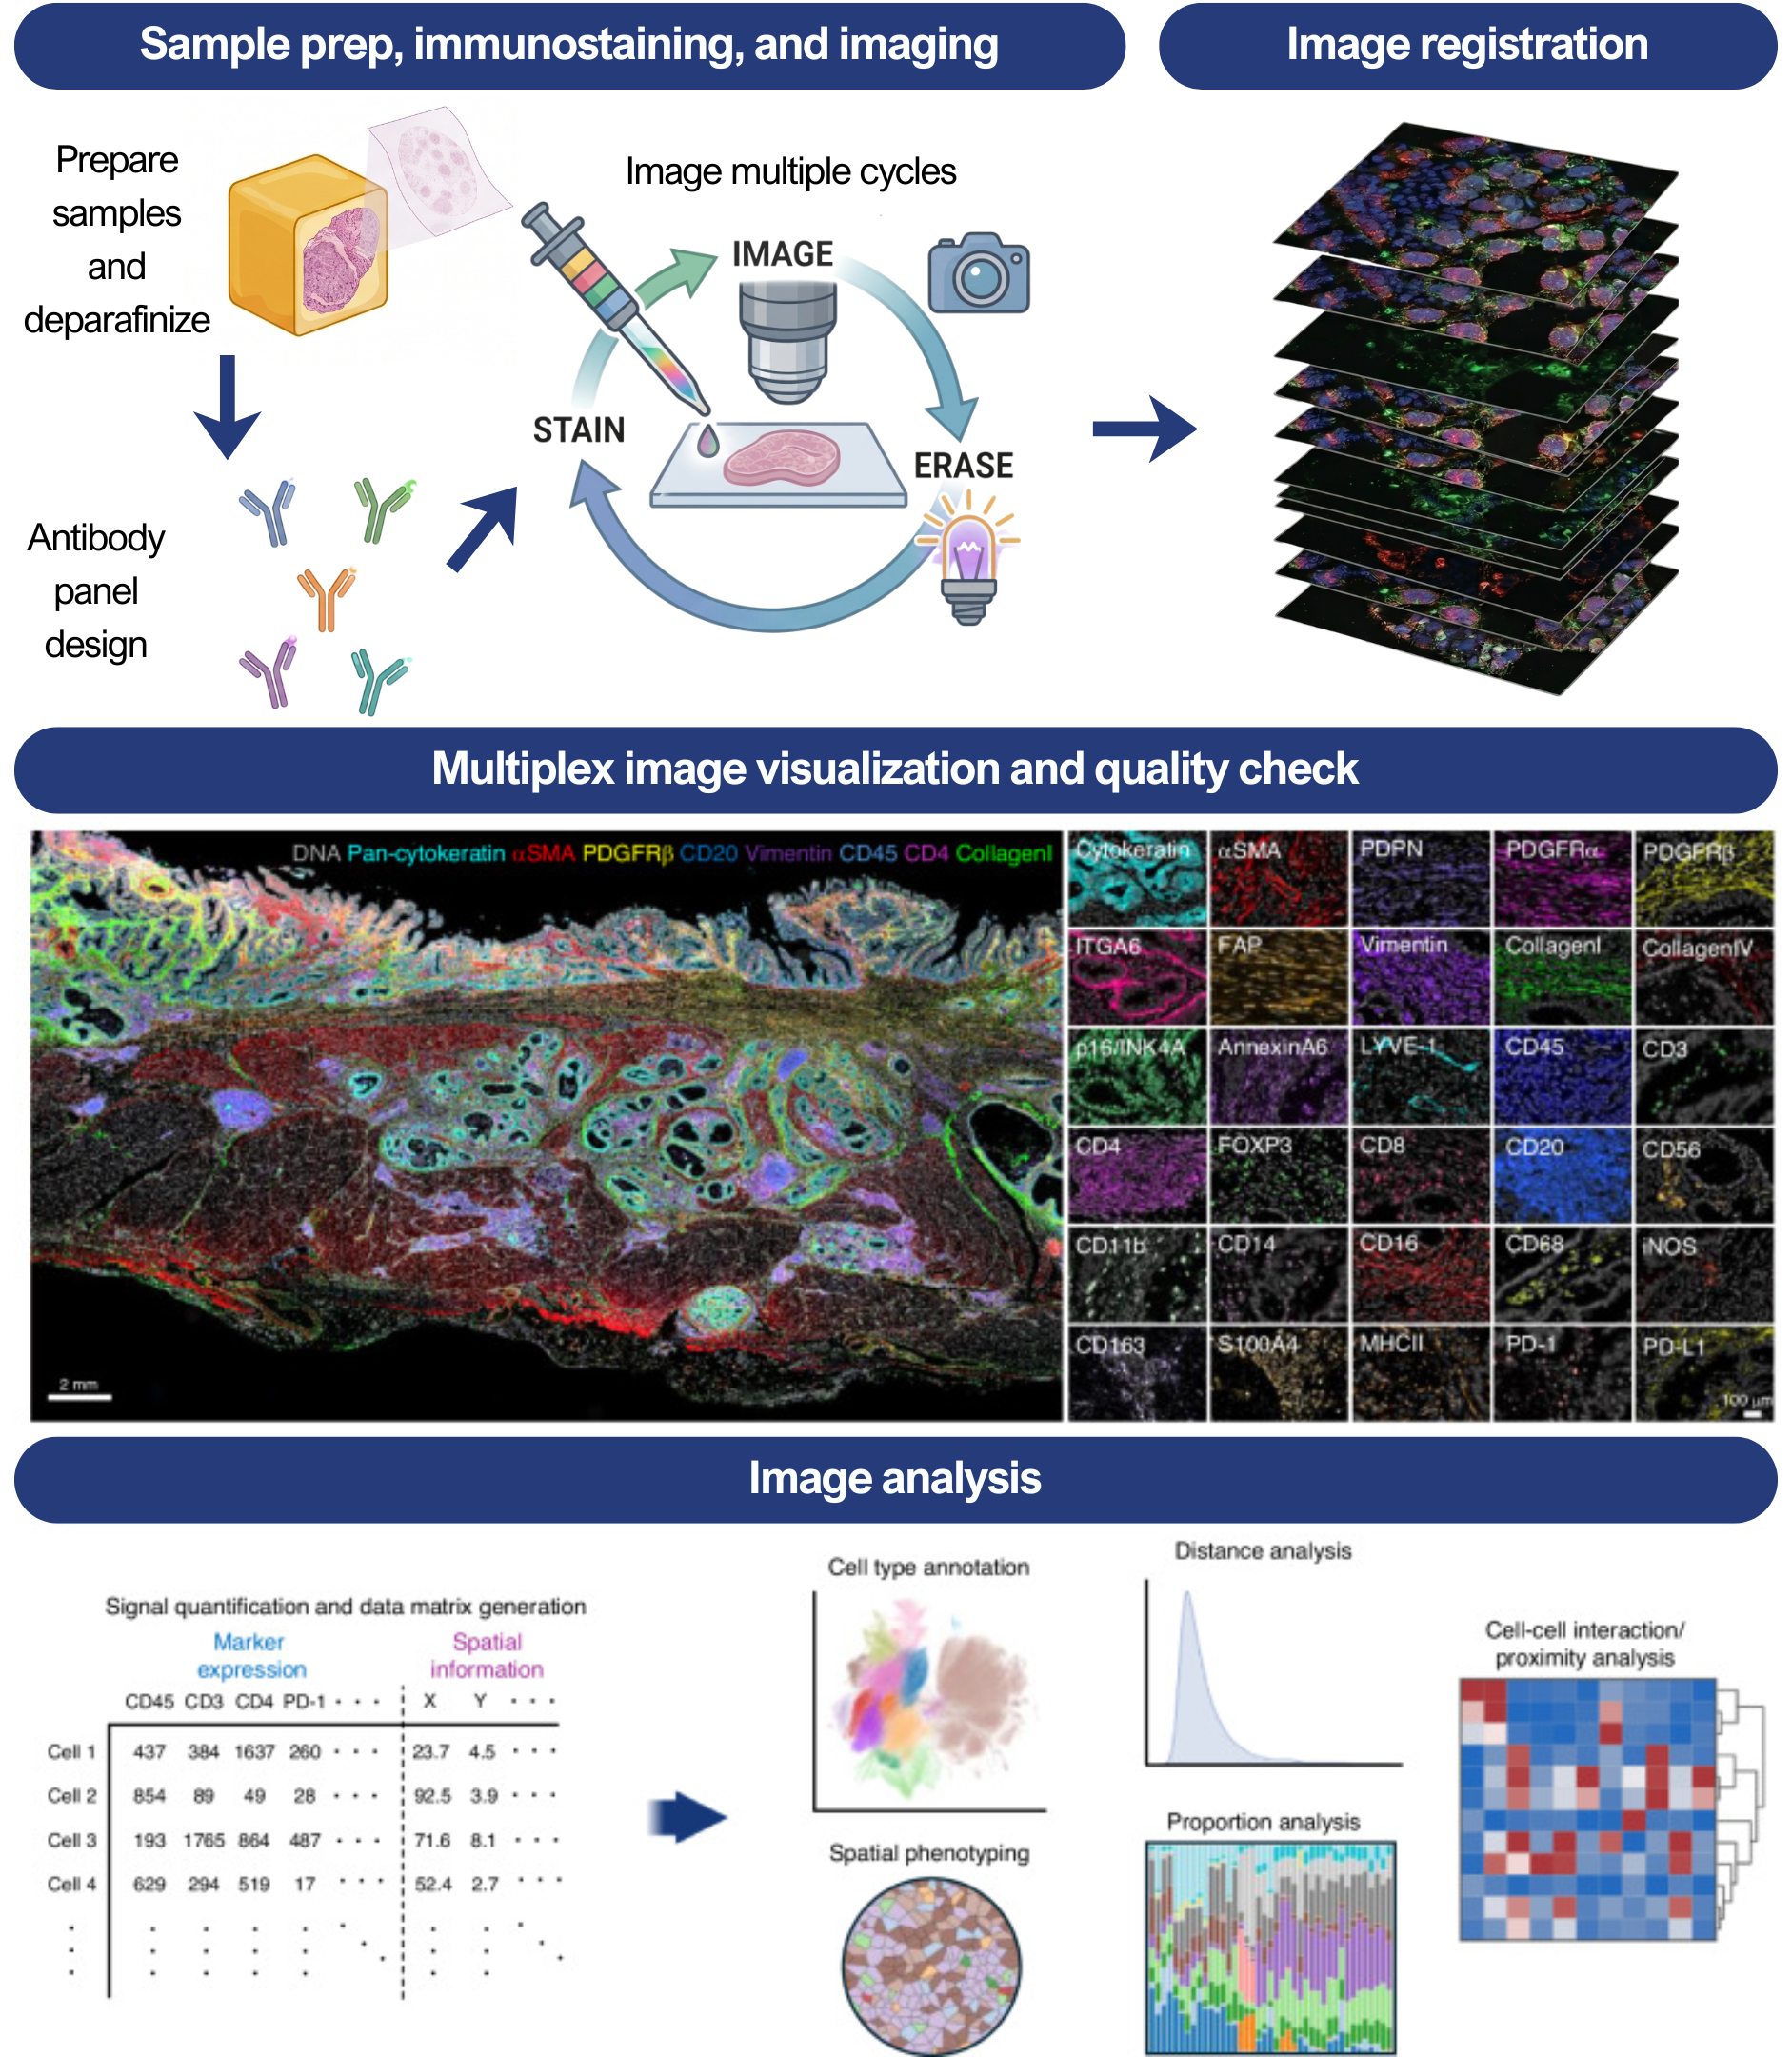
Experimental Workflow
A multiplex imaging experiment takes you from a fresh or FFPE tissue sample to a set of images and single-cell data with marker intensity and localization. The workflow involves several steps, described below.
Sample preparation and panel design
Most clinical and archival samples are formalin-fixed and paraffin-embedded (FFPE). Preparing FFPE tissue for multiplex imaging requires deparaffinization, antigen retrieval to reverse protein crosslinks introduced by formalin fixation, and careful handling to preserve tissue morphology.7 Frozen tissue avoids formalin crosslinking but requires controlled temperature handling throughout. Autofluorescence is a particularly common problem in FFPE tissue and in tissues like brain or liver, and it must be assessed and mitigated before the first staining cycle, as it can bleed into marker detection channels.
Imaging and registration
During image acquisition using cyclic imaging platforms, each staining round is imaged at the appropriate fluorescence channels, and the images from all cycles are then computationally aligned. This process maps every pixel in every cycle back to the same spatial reference frame, so that marker signals can be correctly attributed to the same cell across cycles.
Registration is sensitive to tissue movement between cycles. Even small shifts from swelling or contraction during reagent exchanges can misassign molecules to neighboring cells. Signal decay in late cycles (due to tissue wear or photobleaching) and incomplete signal erasure between cycles are additional sources of noise.9 Checkpoints after each cycle, including visual inspection, can catch problems before they compound.
Mass‑spec imaging uses a single acquisition pass, and suffers from different problems and artifacts, like ablation quality and counting noise.
Image analysis and segmentation
Once all imaging cycles are complete and registered, the image stack can be combined and analyzed. First, individual channel images are combined into a composite that captures the full marker set. From there, cell segmentation identifies individual cell boundaries (typically using a nuclear stain like DAPI alongside one or more membrane markers) and assigns each detected cell a position and a set of marker intensities. This results in a single-cell data matrix, where each row is a cell with x/y tissue coordinates and a measured intensity for every marker. Cell segmentation is foundational to all downstream analysis: errors here propagate through every subsequent step.10
Other analyses are possible depending on the user’s needs. Cell phenotyping classifies cells by their marker expression profiles, using supervised approaches guided by expert annotation or unsupervised clustering algorithms. Area segmentation identifies tissue structures and anatomical compartments so that cells can be analyzed in the context of their surroundings (for example, whether an immune cell sits inside a tumor nest or in the surrounding stroma). Spatial feature analysis then quantifies relationships between cells and structures: proximity, co-localization, and neighborhood composition.
Figure 2: Workflow of multiplex imaging spatial proteomics using cyclic imaging. The main bench steps of sample preparation and antibody panel design are shown. After imaging is performed by the instrument of choice, software is used for registration, visualization, and analysis. Modified from Semba T, Ishimoto T. Br J Cancer. 2024.4
Optimization Tips for Multiplex Imaging
Successful multiplex imaging experiments depend on decisions made at the bench and at the computational stage in roughly equal measure. The most common sources of failure are avoidable with some preparation.
- Tissue quality first: Poor fixation, long cold ischemia time, or inadequate antigen retrieval will limit every downstream step. Check tissue morphology before committing to a multiplex run. For FFPE, ensure retrieval conditions are optimized for your marker set. Different epitopes have different retrieval requirements.7
- Validate antibodies individually before panel assembly: Every antibody in a multiplex panel should be validated in single-plex before combining.8 Check specificity, staining pattern, and signal-to-noise in your tissue type. Titrate to avoid background from overuse and signal loss from underuse.
- Run a pilot before scaling: A two-cycle pilot on a small tissue section reveals autofluorescence levels, signal erasure, and registration quality before you commit a large cohort.
- Manage autofluorescence actively: FFPE tissue and certain tissue types (brain, liver, heart) have high autofluorescence.11 An initial photobleaching step before the first staining cycle reduces background significantly. Check your platform's recommended protocol.
- Monitor registration at every cycle: Do not wait until the end of the experiment to check registration quality. A cycle with poor registration contaminates all downstream analysis.
- Choose your segmentation strategy for the tissue: Nuclear segmentation works well for sparse tissue but whole-cell segmentation using membrane markers is better for dense or overlapping cells. Check your segmentation output visually before using the data matrix downstream.10
- Expect batch effects: If analyzing multiple tissue sections or multiple runs, batch correction is generally necessary.
Main Applications
Multiplex imaging in spatial biology has gained traction in several areas where the spatial organization of proteins is central to answer biological questions.
Tumor microenvironment and immuno-oncology
The tumor microenvironment (TME) is one of the most intensively studied applications of spatial proteomics. Tumors contain more than cancer cells, including surrounding healthy cells, immune cells, blood vessels, and extracellular matrix components. These determine whether a tumor grows, evades immune surveillance, or responds to therapy.12
High-plex spatial protein imaging allows researchers to map which immune cell types are present, where they sit relative to tumor cells, what proteins they express, and where they are positioned. Studies have shown that the distance between immune cells and tumor cells, and the composition of immune cell clusters, can predict immunotherapy response.2,4
Figure 3: Visual representation of some of the applications of multiplex imaging in spatial biology, described in this article.
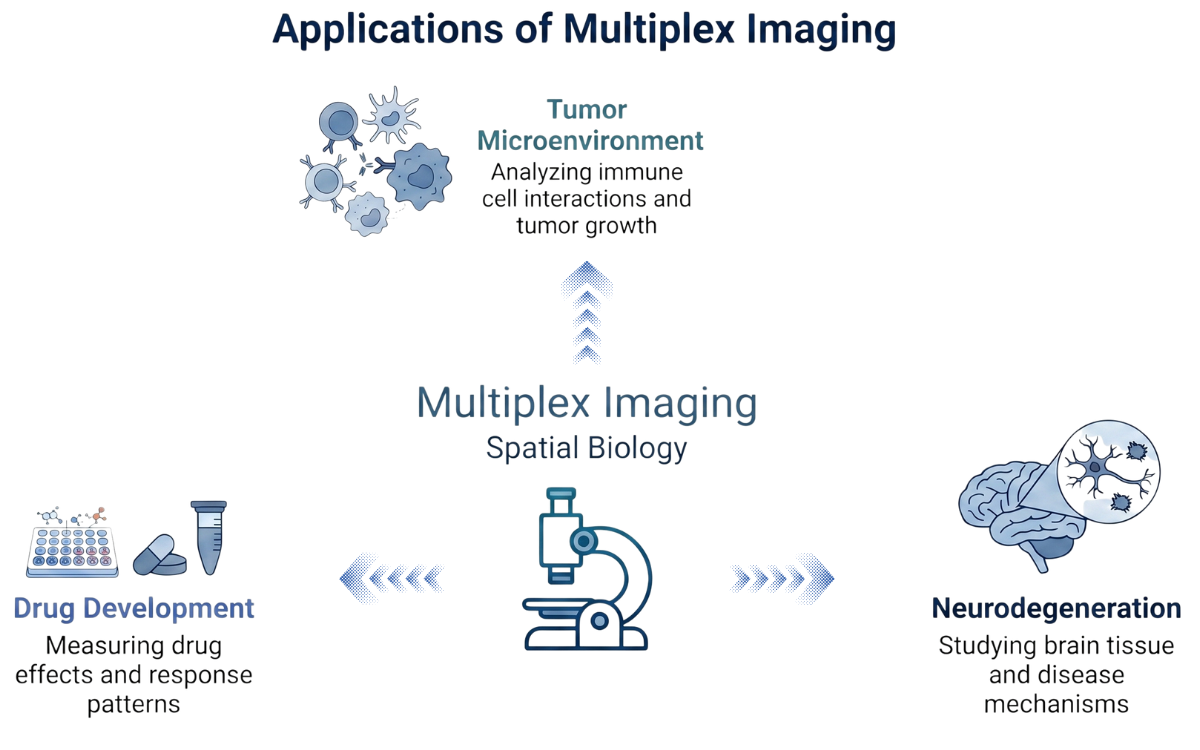
Neurodegeneration
Brain tissue presents unique challenges for multiplex imaging, as it has high autofluorescence, samples are stored as FFPE blocks, and the biological questions involve identifying rare cell states and subtle protein aggregation patterns at spatial resolution. However, bulk proteomics and transcriptomics can characterize overall molecular changes in diseased brain tissue, but cannot resolve what is happening at the level of individual cells or within them.13
Despite difficulties, in Alzheimer's disease research, multiplex imaging has been used to characterize the cellular environment surrounding amyloid-beta plaques and tau neurofibrillary tangles. Spatial biology adds the context that other techniques lack, which leads to new mechanistic hypotheses.
Drug development
In drug development, spatial proteomics is being used to measure pharmacodynamic readouts directly in tissue, identifying the actual effect and location of drugs. Protein-level spatial data allows researchers to assess target engagement, quantify downstream signaling changes, and identify heterogeneous response patterns within a tumor or tissue that would be averaged out in bulk analysis.14 Combined protein and RNA spatial readouts are becoming an increasingly common approach in preclinical and translational study designs where the mechanism of action needs to be resolved at the tissue level.
Frequently Asked Questions (FAQs)
1. How many markers can I realistically run in one multiplex imaging experiment?
It depends on the platform. Cyclic IF platforms like Cell DIVE support 60–200+ markers in practice, DNA-barcoded platforms like PhenoCycler-Fusion 2.0 reach 100+, and single-shot fluorescence platforms like Orion are limited to 18–20. The practical ceiling is often set by antibody availability and tissue quality rather than the instrument itself.
Do I need a custom antibody panel or can I use off-the-shelf antibodies?
Most direct IF cyclic platforms (Cell DIVE, MACSima, CellScape) are antibody-agnostic and accept validated primary antibodies conjugated to standard fluorophores. Indirect IF platforms like COMET are even more flexible, accepting unconjugated primaries. DNA-barcoded platforms like PhenoCycler require antibodies conjugated to their specific barcodes, which are available as pre-conjugated catalogs or as conjugation kits.
3. How do I know if my qPCR efficiency is acceptable?What are the main differences between FFPE and frozen tissue for multiplex imaging?
FFPE tissue is the standard for clinical archives and most translational studies, but formalin fixation introduces protein crosslinks that require antigen retrieval before staining, and FFPE sections have higher autofluorescence than frozen. Frozen tissue preserves antigenicity better but requires careful temperature control throughout processing. Most current platforms support both, but protocol optimization differs significantly between the two.
References
1. Li, Y., Zhang, Y., et al. Spatial proteomics in precision medicine: technologies, bioinformatics, and translational applications. Precision Clinical Medicine 2026;9(1):pbaf040. (https://doi.org/10.1093/pcmedi/pbaf040)
2. Allam, M., Cai, S., et al. Multiplex bioimaging of single-cell spatial profiles for precision cancer diagnostics and therapeutics. npj Precision Oncology 2020;4:11.(https://doi.org/10.1038/s41698-020-0114-1)
3. Lin, J.-R., Fallahi-Sichani, M., et al. Cyclic immunofluorescence (CycIF), a highly multiplexed method for single-cell imaging. Current Protocols in Chemical Biology 2016;8(4):251–264. (https://doi.org/10.1002/cpch.14)
4. Semba, T., Ishimoto, T., et al. Spatial analysis by current multiplexed imaging technologies for the molecular characterization of cancer tissues. British Journal of Cancer 2024;131(11):1737–1747. (https://doi.org/10.1038/s41416-024-02882-6)
5. Zhang, H., Lu, K.H., et al. Mass spectrometry imaging for spatially resolved multi-omics molecular mapping. npj Imaging 2024;2:20. (https://doi.org/10.1038/s44303-024-00025-3)
6. Wang, H., Huang, R., et al. Systematic benchmarking of imaging spatial transcriptomics platforms in FFPE tissues. Nature Communications 2025;16:10215. (https://doi.org/10.1038/s41467-025-64990-y)
7. Faktor, J., Kote, S., et al. Novel FFPE proteomics method suggests prolactin induced protein as hormone induced cytoskeleton remodeling spatial biomarker. Communications Biology 2024;7:708. (https://doi.org/10.1038/s42003-024-06354-8)
8. Gupta, V., Abraham, M.J., et al. Protocol for antibody optimization and panel design in high-dimensional multiplexed immunofluorescence imaging. STAR Protocols 2025;6(4):104236. (https://doi.org/10.1016/j.xpro.2025.104236)
9. Kim, H., Kim, J.-G., et al. Highly accurate image registration for 3D multiplexed cyclic imaging using dense labeling in expandable tissue gels. PLOS Biology 2025;23(7):e3003240. (https://doi.org/10.1371/journal.pbio.3003240)
10. Pang, M., Roy, T.K., et al. CelloType: a unified model for segmentation and classification of tissue images. Nature Methods 2025;22:348–357. (https://doi.org/10.1038/s41592-024-02513-1)
11. Hwang, W., McPartland, T., et al. A robust method for autofluorescence-free immunofluorescence using high-speed fluorescence lifetime imaging microscopy. Scientific Reports 2025;15:5503. (https://doi.org/10.1038/s41598-025-89142-6)
12. Bungaro, C., Guida, M., et al. Spatial proteomics of the tumor microenvironment in melanoma: current insights and future directions. Frontiers in Immunology 2025;16:1568456. (https://doi.org/10.3389/fimmu.2025.1568456)
13. Kang, J., Schroeder, M.E., et al. Multiplexed expansion revealing for imaging multiprotein nanostructures in healthy and diseased brain. Nature Communications 2024;15:9722. (https://doi.org/10.1038/s41467-024-53729-w)
14. Horvath, P., Coscia, F., et al. Spatial proteomics in translational and clinical research. Molecular Systems Biology 2025;21(6):526–530. (https://doi.org/10.1038/s44320-025-00101-9)