A research team has developed an advanced image method that can read metabolic changes at subcellular resolution and does not require staining or disrupting cells. The fluorescence-based technique allowed the researchers to see specific metabolic signatures in cells that could be early indicators of diseases such as diabetes, cancer, and cardiovascular and neurodegenerative disorders. The findings were reported in Science Advances.
 Current methods require the use of contrast agents or disrupting cells in order to perform assays. This novel technique uses two-photon excited fluorescence (TPEF) to detect endogenous fluorescence from two coenzymes—nicotinamide adenine dinucleotide (NADH) and flavin adenine dinucleotide (FAD)—both involved in several cellular metabolic pathways. The team focused on three fluorescence measurements. The first is the relative amount of FAD to NADH which is an indicator of the cell’s health in terms oxygen consumption, sugar metabolism, and break down or production of fat molecules. The second is how much NADH fluorescence fades tells the researchers about the environment around NADH. Lastly, the team measured how NADH is distributed in a cell which illustrates mitochondrial behavior in response to stress or growth.
"Taken together, these three parameters begin to provide more specific, and unique metabolic signatures of cellular health or dysfunction," said Irene Georgakoudi, Ph.D., corresponding author of the study and a professor of biomedical engineering in the School of Engineering at Tufts. "The power of this method is the ability to get the information on live cells, without the use of contrast agents or attached labels that could interfere with results."
This imaging method is a highly sensitive, non-invasive technique to measure biomarkers of specific metabolic pathways at the single cell level. The technique could prove to be a powerful research tool for studying metabolic signatures of disease at an early stage.
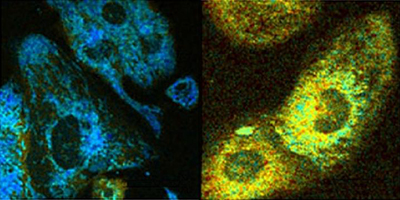
Image: Optical readouts of HL-1 cardiomyocytes in response to chemical uncoupling by CCCP. Redox ratio map for control (left), and CCCP exposed cardiomyocytes (right), courtesy of Irene Georgakoudi, Tufts University.