Although scientists started using fluorescence microscopes more than a century ago, advances in the technology continue at a rapid pace. Basic researchers and clinical scientists use this technology in an ever-increasing range of applications. In many ways, advances in labels drive the expanding realm of ways that scientists make use of this technology. Here, we’ll review some of the ongoing advances in markers and how they can be used.
A flurry of fluorescent dyes
“Nearly 30 years ago, the green fluorescent protein, GFP, was cloned for the first time, kicking off a massive disruption of the fluorescence imaging field by providing a fluorophore that could be genetically expressed and linked to a specific protein of interest,” says John Allen, Applications and Marketing Specialist at Nikon Instruments. “Since that time, fluorophore and probe development has progressed quickly.”
The performance of fluorescent dyes keeps improving. “The emergence of brighter and more stable dyes in the near-infrared (NIR) range has prompted interesting advances in fluorescent imaging,” says Kathy Lindsley, Life Sciences Application Specialist at Olympus. “The availability of these dyes has prompted technological advances such as LED-light engines with improved spectral and microscope systems optimized to take advantage of these dyes.”

Left to right, clockwise: Nuclei (DAPI/405 nm/cyan), actin (Alexa Fluor 488/488 nm/green), mitochondria (Alexa Fluor 543/561 nm/yellow), cell membrane (Alexa Fluor 643/640 nm/blue), and microtubules (Alexa Fluor 750/730 nm/red). Image courtesy of Olympus
Microscopes Search Now Search our directory to find the right microscope for your research needs.
With more dyes available across a wider spectrum, scientists can track a larger number of markers in one experiment. “Other benefits of using NIR dyes include decreased autofluorescence and deeper imaging with less light scatter,” Lindsley says.
Instead of relying on just a fluorophore, scientists can also mark targets with DNA. DNA-PAINT uses a DNA-based system of labeling that can be used in a localization-microscopy technique. “A short single-stranded DNA oligomer—the docking strand—is conjugated to an antibody for labeling the sample,” Allen says. “Into the sample medium, a complementary oligomer conjugated with fluorophore—the imager strand—is introduced.” By tuning the binding kinetics between the docking and imager strands, labels blink, which can be detected with localization microscopy. No sample marking method, though, is perfect, and that includes DNA-PAINT, because it doesn’t usually work with live cells.

Image: 3D DNA-PAINT image of the nuclear lamina protein lamin A/C in a fixed CV-1 cell acquired using the Nikon N-STORM system. This 5.1 um deep z-stack was acquired using 3D astigmatism-based single molecule localization and z-stepping using Nikon’s Perfect Focus System. (a) 2D image with color-coded z position. (b) 3D volume rendering. (c-h) Representative individual z planes, depth denoted in bottom left of each panel. Image courtesy of Nikon
Looking at live cells
In many imaging experiments, scientist like to look at live cells when possible. In fluorescence imaging, the dye plays a key role in live-cell imaging. “Using a dye in the NIR range allows researchers to move away from the more phototoxic ultraviolet, UV, dyes resulting in gentler live-cell imaging,” Lindsley explains.
Other advances in markers also make live-cell imaging more exciting. “Many users are now substituting fluorescent proteins for chemical tags that can also be genetically encoded, most notably the Halo-Tag,” says Allen. “These tags are not intrinsically fluorescent but can be bio-orthogonally labeled with conjugates to the latest and greatest synthetic fluorescent dyes, which have always had overall superior optical performance compared to fluorescent proteins but are not genetically encodable.”
Systems that use Halo-Tags allow imaging in red, far-red, and NIR in live cells. “This is key as the engineering of superior fluorescent proteins in this red-shifted part of the spectrum has proven difficult, with brightness, photostability, and monomericity continuing to lag compared to more blue-shifted variants,” Allen explains. “Imaging with red-shifted light is desired as it is significantly less phototoxic for live cells and allows for imaging at greater depths, because it is scattered less.”
In addition, a new silicon rhodamine dye—a first in developing a high-performance rhodamine dye in the far-red—“is also cell permeable and highly fluorogenic, with fluorescence output increasing many-fold upon interaction with its target,” Allen notes.
Measuring mechanisms in single cells
Rather than analyzing morphology, fluorescence microscopy can also be used to study molecular interactions. Along with the spectral properties of fluorophores, an additional property called fluorescence lifetime can help extract extremely valuable functional properties of biological samples. Giulia Ossato—Product Manager Confocal, Life Science Division at Leica Microsystems CMS—describes a new toolset (TauSense) developed at Leica Microsystems, based on fluorescence-lifetime information as an addition of “new dimension” to traditional intensity-based confocal imaging. For example, “TauSense can characterize calcium oscillations in a population of cells that are loaded with Oregon Green 488-BAPTA, a classical calcium sensor,” independent of concentration of dye loaded into the cells,” Ossato explains. The cells are “perturbed from their basal state via mechanical stimulation, and you can monitor and quantify the response of this perturbation at the single-cell level, compared to the baseline” she says. “The response is recorded as a time-lapse sequence,” that reveals the calcium response in selected single cells.
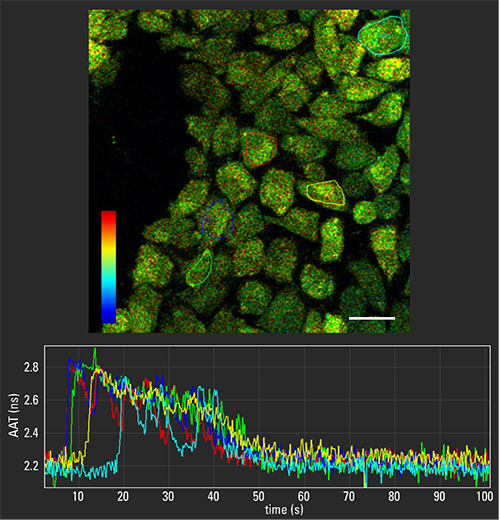
So instead of recording just fluorescence intensity, this technique allows scientists to “explore an additional dimension of information contained in fluorescence,” Ossato says. This includes information about microenvironmental changes, such as ion concentrations. “It also improves image quality—for example, by removing spurious signal contribution—and further expands multiplexing capabilities,” she notes.
Image: Calcium oscillations after mechanical stimulation in mammalian cells loaded with Oregon Green 488-BAPTA, observed with TauContrast on a STELLARIS 5 confocal system. The time series acquired at 4.5 fps, TauContrast traces in different cells (ROI selected in different color). Image size: 256 x 256 pixels. LUT (TauContrast): 0-4 ns. Image courtesy of Leica
Adding even more options
When asked about his wish list for future advances in fluorescence microscopy, Allen says, “That’s a tough question!” After thinking a minute, he says, “Fundamentally, it would be nice to be able to solve the photon-budget issue,” which is the number of photons from a marker, and it’s always limited. “I really feel like it is possible we are working toward some of these probes where you basically have limitless photon budgets,” he says.
Also, related technologies will play a role in improving fluorescence imaging. One key part is picking the right filters (See Optical Filter Selection below).
As the technology for tagging and imaging markers keeps improving, scientists can apply fluorescence imaging to more experimental questions. Plus, the data will be richer and easier to acquire—so easy that any scientist could run very elaborate imaging experiments, all with little experience. The next hundred years of advances will probably take fluorescence imaging to possibilities that we can’t even imagine.
Optical Filter Selection
“Limitations in current systems for accurate measurement of spectral performance constitute a challenging aspect of filter design and validation,” says Xavier El Baz, Product Manager for Semrock-brand Optical Filters at IDEX Health & Science. “Improvements in relevant technologies are being brought to bear, however, and progress is being made in that respect.”
In addition, “instruments are becoming more complex, working along a wide light spectrum,” El Baz says. “Advanced optical-filter products need to follow this trend and are becoming extremely complex to design, manufacture and test.” El Baz adds, “The constant innovation to improve in our validations capabilities is essential.”

Image: Even far into the UV, the Kola Deep system accurately measures a narrow LaserLine filter (Semrock LL01-248) with steep edges from high transmission to beyond OD 7. Kola Deep measurement shown in blue accurately tracks theory curve in green. For comparison, a measurement from a Standard Spectrometer is shown in red and stops tracking the edge at OD 3. Image courtesy of IDEX Health & Science
Like many things in technology, filter systems keep getting smaller. “The miniaturization trend has continued,” says Sarah Locknar, Marketing Manager of Omega Optical. “Filters are being cut down and placed in small packages used in endoscopes.” This opens up new opportunities for fluorescence imaging in clinical applications. “Some approaches to point-of-care diagnostics marry small filter size with microfluidic chips for rapid testing at a clinic or even bedside in minutes instead of hours.” Locknar adds, “Miniaturization can also put a microscope inside of an endoscope, which allows for in situ diagnostics and research in normally behaving animal models.”
When paired with imaging platforms and advanced markers, optical filters add even more opportunities to use fluorescence imaging in basic research and healthcare.