How cancer cells behave—especially those that make up solid tumors—is highly dependent on their surroundings. The tumor microenvironment (TME) is a major focus of many laboratories seeking to understand how malignant cells interact with their cellular (and extracellular) neighbors. How is the cancer influenced by its environment, and, just as importantly, how does the cancer affect the TME? Are there biomarkers that can be targeted as possible treatments?
Knowing what cell types make up a tumor and the patterns they form is an important part of cancer research. This is grossly achieved by histological techniques—typically using dyes and antibodies—to stain features found on the tumor tissue sections, aided by the skilled eye of a pathologist. Other techniques can identify, for example, what genes were expressed.
With researchers always hungry for bigger, better, faster, and more, the field has been developing and embracing techniques allowing them to see tumors in ever greater detail while at the same time providing the context of the tumor’s overall morphology. Questions such as "How many different clones are we dealing with, and which may have evolved from which?," and "What is the mutation driving the malignancy?" can be asked along with "What and where are the immune cells and what role are they likely playing?"
Probing and sequencing
One tool has been to sequence cDNA from selected regions of interest (ROIs) of the tumor, establishing the presence and identity of regulatory T lymphocytes, for example, along with vascular and stromal cells.
But by looking at the tumor microenvironment with only bulk methods “you will often lose out on getting the resolution and capturing the full complexity of the system,” cautions Abbey Cutchin, manager, segment marketing, oncology, for 10X Genomics. It gives you an average, from which you have to try to infer what’s coming from different cell types using statistical inference. It is oftentimes limited in dynamic range and is thus not able to parse out rare subtypes.
If bulk sequencing is like a smoothie, Cutchin says, 10X’s single-cell sequencing (scRNA-seq) is more of a fruit salad, with each piece distinguishable from the others. The RNA expression data is mapped back to the spot on the tissue from whence it came, with an approximate resolution of between one and ten cells.
scRNA-seq is “definitely a revolutionizing technology” that lets you take apart complex tumors and look into their cellular composition, agrees Malte Kühnemund, founder and CTO of Cartana. It can provide an unbiased look at the entire transcriptome. But, he says, it’s extremely expensive and doesn’t have a very high throughput.
Other approaches are more targeted. The RNAscope® in situ hybridization (ISH) assay, for example, uses a proprietary amplification technique to query up to 12 distinct transcripts at a time on a tissue sample. “Labeled probes, containing a fluorescent molecule or chromogenic enzyme, bind to the numerous binding sites on each amplifier,” the website explains.
There are other very sensitive, multiplexed single-molecule FISH (fluorescent ISH) techniques as well, such as MERFISH and seqFISH. “But they are difficult to implement in your own lab because they require extremely sophisticated imaging setups, and the throughput is very low because they need a very high magnification,” Kühnemund explains.
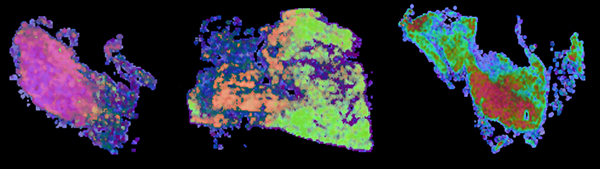
Image: Gene expression profiling of 91 genes in human breast cancer. ISS data was reduced into three dimensions by tSNE analysis and translated into RGB colors. Similar colors in the tissues corresponds to similar gene expression profiles (ISS data from Svedlund et al EbioMedicine 48 (2019) 212–223). Image courtesy of Cartana.
Cartana’s platform, which works on both FFPE and frozen tissue samples, offers higher multiplexing and higher throughput, but not necessarily the sensitivity of other spatial transcriptomics platforms. “We use a barcoded padlock probe—you can have hundreds or thousands at the same time,” explains Kühnemund. “We amplify the barcodes locally and then sequence the barcodes on the spot using a fluorescence microscope.”
Unlike hybridization-only techniques, “we have single-nucleotide resolution, so we can look at mutations,” adds senior scientist Jessica Ostlin.
Looking at proteins
Researchers can also look at the proteins expressed in the TME using a variety of techniques. Flow cytometry and CyTOF mass cytometry, for example, allow for highly multiplexed interrogation at the single-cell level as well, but not histological setting.
Imaging Mass Cytometry™ (IMC™) combines CyTOF® technology with “high-dimensional imaging, enabling deep interrogation of tissues and tumors for single-cell analysis and spatial profiling,” says Dr. Minalini Lakshman, Director, IMC Product Management, at Fluidigm. “Images provide context to detect multiple protein biomarkers and deeply profile TMEs through unrivaled visualization of complex cellular phenotypes and their relationships.”
Traditional immunohistochemistry (IHC) can also yield information about localization of proteins in the TME, but “to stain 60 biomarkers you have to have 60 slides,” says Josette William Ragheb, medical director of pharma services for NeoGenomics Laboratories. Since these are cut on different levels, “you cannot get one cell type with co-expression of different markers.”
NeoGenomics’ MultiOmyx™ Hyperplexed Immunofluorescence Assay uses repeated rounds of staining, imaging, and inactivation to read out the expression of up to 60 markers on a single 4 um FFPE slide. “If someone wants to study more, we take the slide back, scratch it to extract DNA or RNA, and run any other molecular tests,” William Ragheb points out.
Dissecting the TME—parsing out which cell types are present and their spatial relationship to each other, which mutations are driving the tumor, what cytokines and checkpoint molecules infiltrating lymphocytes express, how distinct regions respond to treatment, etc.—can lead to a better understanding of potentially deadly malignancies and ultimately to their treatment. More and more, researchers are combining spatial visualization of the tumor with a molecular survey, allowing detailed maps to be created that can be used to further guide research and translation.
Hero image: Mapping the tumor microenvironment by Cartana in situ sequencing (ISS) of >50 genes in a human melanoma section. Each ISS dot corresponds to a single RNA molecule within the cell and is visualized by fluorescent labeling.