Summary
Flow cytometry represents a powerful tool for understanding the heterogeneity of tumors and their normal tissue counterparts. Along with the ability to interrogate millions of cells and characterize rare populations with respect to expression of multiple parameters comes the loss of information on tissue location. This brief article will discuss a method for combining flow cytometric analysis of dissociated solid tissues with immunohistostaining of tissue sections with emphasis on the unique requirements for tissue preparation and data analysis.
Introduction
Multi-parameter flow cytometry and cell sorting are universal and versatile technologies that have been used for the identification and isolation of the clonogenic stem/progenitor cells. Traditionally, flow cytometry has been used to study the liquid tissues, blood and bone marrow, and tissues that can easily be made into single-cell suspension, such as spleen and lymph node. However, with mechanical and enzymatic tissue dissociation, flow cytometry can be used to study normal and malignant cells isolated from solid tissue. The quality of the data depends on careful preparation of samples, instrument calibration and exclusion of sources of artifact during data analysis.

Figure 1- Schematic representation of the workflow for single-cell analysis of solid tissues
Methods and Results
Figure 1 shows a schematic of the workflow from tissue acquisition to analysis of singlecell suspensions prepared from solid tissues.
Tissue Procurement
Human tissue is most commonly isolated in the operating or procedure room. The fastest way to procure tissue for research is to directly involve the pathologist who is responsible for obtaining a sufficient diagnostic sample before waste material is allocated for research. In the best of circumstances, the tissue can be divided immediately and rushed back to the research laboratory, immersed in anticoagulated collection medium on wet ice. Small tissue fragments can sometimes be stored overnight under these conditions without appreciably affecting viability, but this varies with the tissue source.
Tissue Processing
Upon accession in the laboratory, the specimen is weighed, a physical description is recorded, and a sample is taken for fixation and paraffin embedding. An understanding of the sample histology and the location of key antigenic markers, as determined by immunofluoresence and immunohistochemistry, is essential to the correct interpretation of flow cytometric data obtained on single-cell preparations.
Digestion
The remaining tissue is weighed again and mechanically and enzymatically disaggregated into a single-cell suspension. Especially where tumors are concerned, this is an empirical process because different samples will require more or less aggressive treatment. Collagenase is the most commonly used enzyme, followed by dispase and trypsin. The first two require calcium and magnesium, whereas trypsin works optimally in the absence of divalent cations and is often combined with a chelating agent such as EDTA. Mechanical disaggregation can be accomplished with paired scalpels, scissors, screens, or devices. Enzymatic digestion is performed in an incubator (small samples) or a shaking water bath. The process often requires centrifugation, harvest of single cells and redigestion of tissue fragments. Addition of DNAse is often critical because dying cells release DNA which traps viable cells, greatly reducing cell yield. The sample should be visually inspected at all phases of tissue digestion. In the final stage, cell suspensions are passed through a 70 to 200 micron filter to remove aggregates. Cell suspensions are then counted and viability is determined by a dye exclusion assay, such as trypan blue. Automated hematology counters overestimate the count of such samples and should be avoided. A simple hemocytometer, or an image-based cell counter will suffice. At this point, the cells can be examined microscopically using a cytocentrifuge preparation and histological stains. This provides a permanent record of the results of sample dissociation. Samples may also be removed for tissue culture.
Flow Cytometric Staining
Efficient staining depends chiefly on using the optimal monoclonal antibody concentration. Calculations based on volume of antibody per million cells are misleading and result in wasted reagent. Using too high a concentration of antibody results in a decreased signal-to-noise ratio (separation between negative and positive populations) because of increased non-specific binding to the negative population. Using too low a concentration results in a dimmer positive population with greater spread. Optimization of antibody concentration is an empirical process which must take into account the dilution of each antibody with other antibodies in the preparation. Rules of thumb for staining include:
- Concentrate cells and stain in the smallest practical volume.
- Stain an appropriate number of cells for the frequency of the populations of interest.
- Stain on ice in the dark.
- Pre-incubate cells with decomplemented mouse serum to block non-specific antibody binding.
- Reserve the best fluorochrome (e.g., PE) for the dimmest marker.
- Include a dump marker (for which cells of interest are known to be negative).
- Run single stain controls for each antibody-fluorochrome combination (be especially careful with tandem dyes).
- Run all FMO controls (staining combinations eliminating antibodies one at a time) initially during assay development until staining patterns are known. Continue using FMO controls that are critical to region placement.
- Fix cells with methanol-free EM grade formaldehyde, hold stained cells in the dark, and run on the flow cytometer as soon as possible.
Flow Cytometric Acquisition and Data Analysis
Multiparameter flow cytometry can be daunting to analyze. Follow these steps:
- Make sure that the cytometer has been well standardized and is functioning properly. Beads are used to check fluidics, optics, laser output and PMT gain. Standardize PMT gain to bead target channels rather than to a fixed voltage.
- Run the single-stained compensation standards and perform spectral compensation off-line during data analysis using automated compensation software.
- Perform data analysis in four steps:
- Remove sources of interference and artifact by creating Boolean gates. Pulse analysis should be used routinely for elimination of doublets, cell clusters and coinciding events. Use light scatter properties, viability dyes, or DNA content to eliminate dead and dying cells. Use the time parameter to spot transient fluidic disturbances and gate them out.
- After defining “clean events” above, identify classifier populations. These are populations of interest with known marker expression. Positive and negative gating strategies should be employed: for example, defining epithelial cells as CD45 negative and cytokeratin positive.
- Measure outcome parameters on pre-defined classifier populations: For example, DNA content and cell-cycle specific proteins on epithelial cells, or CD44 and CD90 expression on epithelial tumor cells.
- Compare staining patterns of single-cell populations and tissues (immunostaining studies above). Inferences can often be drawn concerning the tissue location of populations of interest (defined by multiparameter flow) on the basis of the location of a few key immunostaining markers. The location of rare populations not visualized by tissue staining can sometimes be inferred. Also, selection bias resulting from selective loss of some populations during sample dissociation can be estimated by approximating population frequencies in stained tissue sections.
Fluorescence-activated Cell Sorting
Sorted cells can be used for functional studies, cell culture, in vivo xenotransplantation studies or molecular characterization.
- Make certain to optimize antibody concentrations and maximally concentrate the cells. Given a small staining volume, it is surprising how many cells (100s of millions) can be stained with a few microliters of antibody.
- Sorting is expensive. Pilot the sort strategy using analytical flow cytometry to test assumptions about defining populations of interest and determining their frequencies.
- Keep cells cold and in the dark in buffer containing serum albumin and EGTA or EDTA to prevent clumping.
- Filter cells immediately prior to sorting
- Determine whether to prioritize cell recovery at the expense of purity, or purity at the expense of recovery. For rare populations, you cannot have both.
- Sort into serum albumin or calf serum.
- For molecular characterization sort directly into a preservation solution or lysis buffer (take care not to dilute the preservation solution or lysis buffer too much).
An Example of Flow Cytometric and Immunohistologic Data Analysis of Normal Human Breast Ducts
Figure 2 provides an example of the power of combining multi-parameter flow cytometry on a single-cell suspension prepared from normal breast tissue with immunohistostaining for the key markers cytokeratin and CD44. The upper panel shows our strategy for artifact removal. Forward scatter pulse analysis (pulse height versus pulse width) removes doublets and cell clusters, events with a pulse width too high for their pulse height. In this example, 39.8% of events were identified as clusters and eliminated from further analysis. In the next histogram we have capitalized on the use of the fix and permeabilize protocol required for intracellular cytokeratin staining to include the stain DAPI to measure DNA content. Only 36% of the singlet events had 2N or greater DNA; the majority was either hypodiploid apoptotic cells, or subcellular debris. Finally, singlet events with ≥ 2N DNA content were analyzed for the expression of the hematopoietic markers CD45 and a lineage cocktail consisting of CD14, CD33 and glycophorin A. Only events lacking the expression of these markers are candidates for epithelial cells. Of note, this approach not only removes bona-fide hematopoietic cells, it also removes autofluorescent cells (spontaneously positive in the PECy5 channel) and cells which have nonspecifically bound the hematopoietic lineage antibodies.
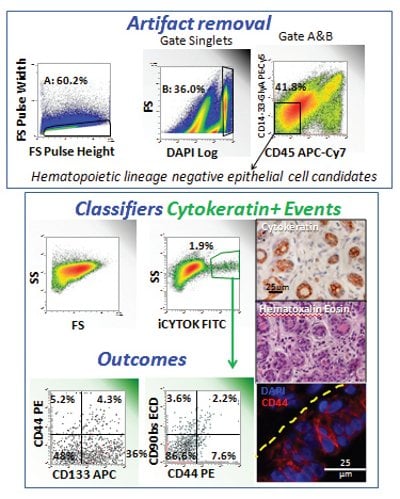
Figure 2- Use of immunohistostaining to determine the tissue location of populations detected by multi-parameter flow cytometry on dissociated normal breast tissue. This figure illustrates a four-step data analysis scheme in which sources of artifact are removed from flow cytometric data by Boolean gating, a classifier population of interest is identified (cytokeratin+ cells), outcome parameters are measured on the classifier population, and the results are compared to immunostaining of fixed paraffin embedded tissue from the same sample. The dashed yellow line indicates the wall of a normal breast duct in longitudinal section.
After potential sources of artifact have been removed from the numerator and denominator by Boolean gating, we are ready to identify our population of interest, cytokeratin-positive epithelial cells. We have termed this process ‘identifying a classifier population.’ In this example, there is only one classifier, but there may be several, and classifiers may be branched. Here, cytokeratin-positive cells represented 1.9% of heme-lineage negative cells or 0.8% of all clean singlet events. Inspection of a paraffin section from the same sample immunohistochemically stained for cytokeratin shows that only the breast ducts (here shown in cross section) are cytokeratin positive. Further, in the native tissue they represent more than 0.8% of total cells, alerting us to the fact that our processing to achieve a single-cell suspension has resulted in some selection bias against ductal cells.
After we have defined our classifier population, we are ready to measure our outcome parameters, variables that provide information about the state or function of our classifier population(s). In this example we are examining expression of the stem/progenitor markers CD90 and CD133 in conjunction with the adhesion molecule CD44. Immunofluorescent staining of a paraffin section of this sample shows CD44 expression in a longitudinal section of breast duct. The yellow dashed line (Figure 2) indicates the duct wall. Some basal cells stain CD44 negative/dim and expression increases as cells migrate luminally. Comparing immunofluorescent staining to the flow cytometry outcome parameters, a significant population (36%) of cytokeratin+, CD44- cells express the stem/progenitor marker CD133. CD90 expression is rare and equally distributed among CD44- and CD44+ ductal cells.
References
- Zimmerlin, L., Donnenberg, V. S., Pfeifer, M. E., Meyer, E. M., Peault, B., Rubin, J. P., and Donnenberg, A. D. (2010) Stromal vascular progenitors in adult human adipose tissue. Cytometry A 77A, 22-30
- Donnenberg, V. S., Donnenberg, A. D., Zimmerlin, L., Landreneau, R. J., Bhargava, R., Wetzel, R. A., Basse, P., and Brufsky, A. M. (2010) Localization of CD44 and CD90 positive cells to the invasive front of breast tumors. Cytometry B Clin Cytom, 78(5):287-301.
- Zimmerlin, L., Donnenberg, A. D., Rubin, J. P., Basse, P., Landreneau, R. J., and Donnenberg, V. S. (2011) Regenerative therapy and cancer: in vitro and in vivo studies of the interaction between adipose-derived stem cells and breast cancer cells from clinical isolates. Tissue Eng Part A 17, 93-106.
- Donnenberg, V. S., Luketich, J. D., Landreneau, R. J., DeLoia, J. A., Basse, P., and Donnenberg, A. D. (2006) Tumorigenic epithelial stem cells and their normal counterparts. Ernst Schering Foundation Symposium Proceedings 5, 245-263.
- Donnenberg, A. D., and Donnenberg, V. S. (2007) Rare-event analysis in flow cytometry. Clin Lab Med 27, 627-652, viii.
- Donnenberg, A. D., and Donnenberg, V. S. (2008) Understanding Clinical Flow Cytometry. In Handbook of Human Immunology (O’Gorman, M. R., and Donnenberg, A. D., eds) pp. 181-220, CRC Press Taylor and Francis, Boca Rato
- Donnenberg, V. S., and Donnenberg, A. D. (2009) Therapeutic Index and the Cancer Stem Cell Paradigm. In Stem Cells and Cancer Series: Cancer Drug Discovery and Development (Bagley, R., and Teicher, B., eds), Springer, Humana Press, New York.
- Donnenberg, V. S., Meyer, E. M., and Donnenberg, A. D. (2009) Measurement of Multiple Drug Resistance Transporter Activity in Putative Cancer Stem/ Progenitor Cells. In Methods in Molecular Biology (Yu, J., ed) Vol. 568 Cancer Stem Cells pp. 261-279, Humana Press, Springer, New York.
- Zimmerlin, L., Donnenberg, V. S., and Donnenberg, A. D. (2011) Rare Event Detection and Analysis in Flow Cytometry: Bone marrow mesenchymal stem cells, breast cancer stem/progenitor cells in malignant effusions, and pericytes in disaggregated adipose tissue. In Flow Cytometry Protocols (Hawley, T. S., and Hawley, R. G., eds) Vol. 699, Humana Press, New York.
Acknowledgements
This work was supported by grants BC032981 and BC044784 from the Department of Defense, the Hillman Foundation and the Glimmer of Hope Foundation. Vera Donnenberg is a CDMRP Era of Hope Scholar.
The authors would like to thank Melanie Pfeifer and E. Michael Meyer for their expert technical assistance.
Author Biographies
Vera S. Donnenberg and Albert D. Donnenberg share life, laboratory and leisure. Vera obtained a Masters degree in Clinical Pharmacology at Johns Hopkins and her Ph.D. in Pharmaceutical Sciences at the University of Pittsburgh. She is currently Associate Professor of Surgery at the University of Pittsburgh School of Medicine.
Albert majored in Philosophy at the University of Colorado and obtained a Ph.D. in Infectious Disease Epidemiology at The Johns Hopkins University. He is currently Professor of Medicine at the University of Pittsburgh. Vera and Albert collect art, make wine and tend to their cabin in the Laurel Highlands.
This article was printed in the 11/14/2011 issue of International Drug Discovery,6,, 5,. Copyright rests with the publisher.