Slow and steady succinctly describes the advances that have occurred in small animal in vivo optical imaging since Biocompare’s last overview of the topic a year and a half ago. As the name implies, these techniques utilize light to inform on organisms like mice and zebrafish. Typically cells expressing fluorescent or bioluminescent reporters, or perhaps probes seeking out molecular targets or functions in the animal, are introduced, resulting in the emission of light of particular wavelengths (perhaps after excitation, in the case of fluorescence) that can be detected by the imager.
Advantages, such as the minimally invasive nature, and the ability to use the same animals over time for longitudinal studies, without radiation, are legend. So, too, are shortcomings such as the limits to depth penetration (note the prevalence of mouse models, not rat or rabbit models) and lack of anatomical localization.
Many established instruments—either explicitly designed for in vivo imaging, or adopting the tech from other imaging apps like gel documentation—are still workhorses, and in these, many people agree, there has been incremental but perhaps not revolutionary improvements.
Here we look at the current state of small animal optical imaging, highlighting some recent developments.
In vivo imaging
Since their introduction in the late 1990s, small animal in vivo imaging systems could conceptually be divided into two parts: the first is the instrumentation—a light-tight box, light-sensing hardware, and the image processing and acquisition software associated with it, notes Neal Paragas, co-founder of InVivo Analytics, and assistant professor at the University of Washington and director of the SLU Imaging Center. The second part consists of the animal models and reporters such as fluorescence or luciferase/luciferin systems.
Optical imaging has along the way benefitted from more sensitive cameras, greater processing power and data storage capacity, and more sophisticated algorithms. Correlating with other imaging modalities—by using common equipment, or shuttles between instruments that allow for co-registration of fiducial markings, for example—has become easier, and in some cases seamless, allowing for complementary data to be garnered from the same animals simultaneously or over time. Versions of three dimensionality, sometimes controversial, have been introduced and embraced, allowing signal depth and strength to be better approximated.
Entry-level basic gel documentation like Analytik Jena’s Gel-Studio platforms “do a really nice job screening animals … evaluating for the growth/no-growth of bright fluorescent protein tagged tumors,” points out Sean Gallagher, VP, research and development at Analytik Jena US. In contrast, for quantitative near infrared (NIR) and bioluminescent tumor detection, dedicated, sophisticated, and more expensive cooled cameras systems, complete with deep vacuums around the sensor, are used because sensitivity is paramount.
One-click selection of regions-of-interest (ROI) within imaging software platforms makes analysis of images easier and more standardized. In addition, some systems let the user choose whether the data is returned raw or processed prior to the analysis, with background subtracted, noise reduction, or other image processing calculations performed for them.
Analytic Jena offers systems with long working distance optics to allow for microscopic interrogation of tumors under skin flaps, for example.

Image: Kinetic curve study with Analytik Jena iBox Scientia 900. Mice were injected with 15 mg/mL solution of D-luciferin prior to anesthetization with ketamine-xylazine. Images were captured 5 minutes post-injection and in intervals of 10 minutes thereafter. A white and BLI composite image pseudocolored with a heatmap are shown to demonstrate the relative levels of BLI signal in a mouse bearing a subcutaneous lung carcinoma tumor.
The ability to produce brighter, more stable signals—sometimes under challenging conditions—has grown along with the ability of the instrumentation to detect them. A greater diversity of probes, from affinity reagents to protein and chemical reporters, encompassing a larger array of wavelength options, has facilitated ever-more experimental inquiry.
Far out colors
It’s not news that biological samples tend to absorb, scatter, and autofluoresce light in the visible spectrum—more so closer to blue, less so in the red—severely limiting the ability to probe deep even into mice with any appreciable resolution. This has led the field to explore longer wavelengths.
Many optical imaging reagents that utilize far red and NIR wavelengths have become available in both the commercial as well as the academic spheres, including luciferase/luciferin systems as well as fluorescent reporter backbones. Instruments with the filter sets and software allowing animals emitting in these spectra to be imaged are not difficult to find.
Yet there is still significant light scattering and autofluorescence in the traditional NIR (~700–900 nm, often termed NIR-I) range, which can largely be overcome by extending into the NIR-II, or SWIR (short wavelength infrared). Yet different optical equipment, currently based on indium gallium arsenide (InGaAs)-based sensors, “are the cameras that have the quantum efficiency that you need, [and] the availability of this hardware is quite recent,” says Stephen Marchant, life sciences accounts manager for Photon Etc.
Although the individual components with SWIR cameras (from companies such as Raptor Photonics and Photon Etc) have previously been cobbled together by researchers, Gallagher believes that Photon Etc is the “first out of the gate” with a complete, commercially available NIR-II imaging system.
Development of instrumentation and of reagents, of course, go largely hand-in-hand, with little point in creating a probe that researchers do not have the equipment to image, and little incentive to engineer imagers for nonexistent dyes. It was recently found that indocyanine green (ICG), an NIR-I dye long approved for use in humans, along with the Li-COR IRDye 800CW and others, “have long emission tails that move into the SWIR,” notes Marchant. “When you image these probes at wavelengths over 1250 nm, the resolution you get is incredible,” in some cases comparable to or better than microCT.
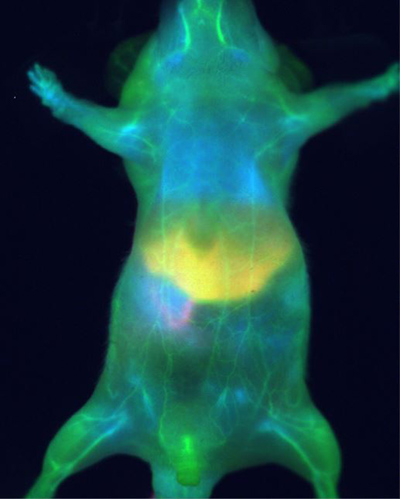
Image: Mouse in NIR-II. Image courtesy of Photon Etc.
More NIR-I probes with long emission tails in the NIR-II, as well as probes specifically designed to emit in the NIR-II, are being developed. NIR-II is starting to be used to measure heartbeat, respiration rate, hepatobiliary elimination, and intestinal contractions. Marchant notes: “the cardiography is contact-free.”
On the surface
One way to avoid the pitfalls of attenuation of visible range signals by tissue is to image the surface. Wellington Pham, associate professor of radiology and radiological sciences at Vanderbilt University, has focused on the development of optical probes for the detection of colorectal cancer using fluorescence colonoscopy. “If your biomarker is on the surface [of the colon], using a fluorescence endoscope you can detect the polyps or the cancer very easily without any worry about [signal] penetrating the tissue,” he says.
Yet even something like pancreatic cancer can be detected by endoscopy, basically by poking a hole in the abdominal area and inserting the scope. And (if biomarkers are available) endoscopy can also be used for tumor margin surgery, Pham says, “you want to see the tumor margin so you don’t remove too much or too little.”
Normalizing image analysis
“Our goal is to automate the process, to remove the variability, to remove the bias” of where a technician draws an ROI, says Paragas.
His company uses a size-specific mold to hold the animal in a precise position and mirrors to give a 3D view. Sophisticated algorithms—which can differentiate, for example, how light propagates through skin or muscle versus how it traverses a blood-rich organ like the liver—help determine where in a mouse the signals are coming from. This is combined with a statistical digital atlas “which we call the organ probability map,” he explains. “Since the animal is in a defined position, when you acquire the data in the mold, we can now upload that data and it can be cropped automatically.” Cloud-based machine-learning algorithms analyze the data.
InVivo Analytics is manufacturer agnostic, meaning their hardware and analysis protocol can be used with imaging systems from a variety of manufacturers. And “they can easily be correlated with a variety of other modes such as 3D X-rays, 3D fluorescence detection, PET scans, and so on, of small animals,” Gallagher explains.